
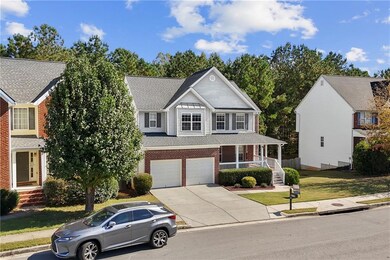
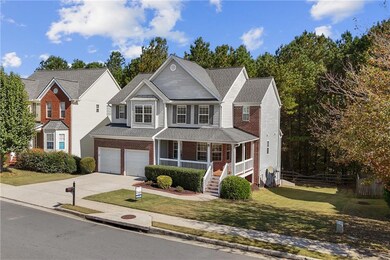

3751 Roxfield Dr Unit 2 Buford, GA 30518
Highlights
- View of Trees or Woods
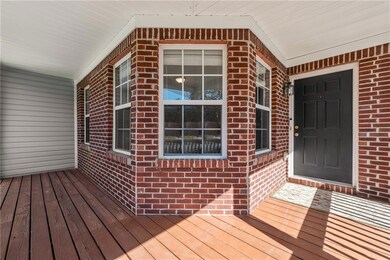
- Deck
- Traditional Architecture
- Sugar Hill Elementary School Rated A
- Property is near public transit
- Whirlpool Bathtub
About This Home
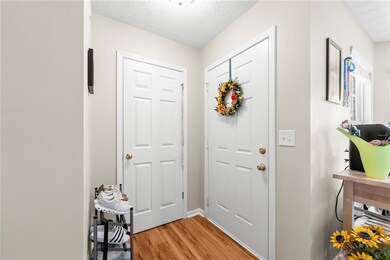
!!! WELCOME HOME !!! Beautifully maintained 4BR/2.5BA home in the family-friendly neighborhood of Roxwood Park. Entering the home, you will find a flex office/library space and dining room as you make your way to the fully remodeled kitchen with granite countertops, oversized island, and white cabinets. Updated flooring & interior paint throughout the home, with lower level floors updated to warm tone LVP and upper level grey luxury carpet. Eat-in kitchen opens up into family room with cozy fireplace, with doors leading out to the deck, perfect for grilling and transitioning smoothly for entertaining. Upper level has a master bedroom with tray ceilings with separate walk-in closet. Master bathroom features double vanities with newly renovated tiled shower and jacuzzi tub. Secondary bathrooms receive ample natural sunlight and all bathrooms have new toilets, replaced this month. So much potential with unfinished daylight basement with separate entry if needed. New HVAC(Traine 2.5 tons) on upper & lower level replaced earlier this year & roof is also only 7 years old! APPLIANCES INCLUDING LG STAINLESS STEEL 4-DR FRENCH DOOR W/ INSTAVIEW DOOR-IN-DOOR & SAMSUNG WASHER/DRYER STAY WITH THE PROPERTY. Sellers have raised their family in this home and have taken exceptionally good care of it.
Home Details
Home Type
- Single Family
Est. Annual Taxes
- $2,283
Year Built
- Built in 2004
Lot Details
- Property fronts a private road
- Landscaped
- Back Yard Fenced and Front Yard
Parking
- 2 Car Garage
Property Views
- Woods
- Neighborhood
Home Design
- Traditional Architecture
- Shingle Roof
- Composition Roof
- Vinyl Siding
- Brick Front
Interior Spaces
- 2,260 Sq Ft Home
- 2-Story Property
- Crown Molding
- Ceiling Fan
- Great Room with Fireplace
- Formal Dining Room
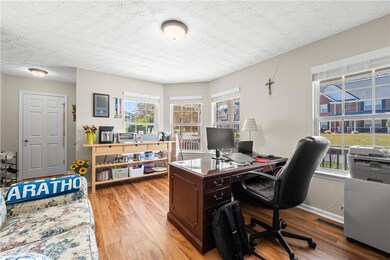
- Home Office
- Pull Down Stairs to Attic
- Fire and Smoke Detector
Kitchen
- Open to Family Room
- Breakfast Bar
- Gas Oven
- Gas Range
- Range Hood
- Microwave
- Dishwasher
- Kitchen Island
- Stone Countertops
- White Kitchen Cabinets
- Disposal
Flooring
- Carpet
- Luxury Vinyl Tile
Bedrooms and Bathrooms
- 4 Bedrooms
- Dual Vanity Sinks in Primary Bathroom
- Whirlpool Bathtub
- Separate Shower in Primary Bathroom
Laundry
- Laundry Room
- Laundry on upper level
- Dryer
- Washer
Unfinished Basement
- Exterior Basement Entry
- Natural lighting in basement
Outdoor Features
- Deck
- Wrap Around Porch
Location
- Property is near public transit
- Property is near schools
- Property is near shops
Schools
- Sugar Hill - Gwinnett Elementary School
- Lanier Middle School
- Lanier High School
Utilities
- Forced Air Zoned Heating and Cooling System
- Heating System Uses Natural Gas
- Underground Utilities
- Gas Water Heater
- Phone Available
- Cable TV Available
Listing and Financial Details
- Security Deposit $2,600
- 12 Month Lease Term
- $60 Application Fee
- Assessor Parcel Number R7215 336
Community Details
Overview
- Property has a Home Owners Association
- Application Fee Required
- Roxwood Park Subdivision
Recreation
- Tennis Courts
- Community Playground
- Community Pool
- Trails
Map
Source: First Multiple Listing Service (FMLS)
MLS Number: 7673432
APN: 7-215-336
Disclaimer: Certain information contained herein is derived from information provided by parties other than Homes.com. All information provided is deemed reliable, but is not guaranteed to be accurate and should be independently verified.
![]() Listings identified with the FMLS IDX logo come from FMLS and are held by brokerage firms other than the owner of this website. The listing brokerage is identified in any listing details. Information is deemed reliable but is not guaranteed. If you believe any FMLS listing contains material that infringes your copyrighted work please visit www.fmls.com/dmca to review our DMCA policy and learn how to submit a takedown request. © 2025 First Multiple Listing Service, Inc.
Listings identified with the FMLS IDX logo come from FMLS and are held by brokerage firms other than the owner of this website. The listing brokerage is identified in any listing details. Information is deemed reliable but is not guaranteed. If you believe any FMLS listing contains material that infringes your copyrighted work please visit www.fmls.com/dmca to review our DMCA policy and learn how to submit a takedown request. © 2025 First Multiple Listing Service, Inc.
- 3811 Roxfield Dr
- 3725 Roxwood Park Dr Unit 1
- 812 Holly Meadow Dr
- 3805 Roxwood Park Dr Unit 1
- 665 Roxford Ln Unit 3
- 3929 Two Bridge Dr
- 3740 Crescent Walk Ln
- 3720 Crescent Walk Ln
- 3941 Oak Crossing Dr
- 3998 Oak Crossing Dr NE
- 3612 Brookefall Ct
- 870 Creekview Bluff Way
- 1320 Newbridge Cir
- 3645 Hickory Branch Trail Unit 1
- 957 Pont Du Gard Ct
- 3720 Brookefall Landing
- 3835 Creekview Ridge Dr
- 4071 Woodward Walk Ln
