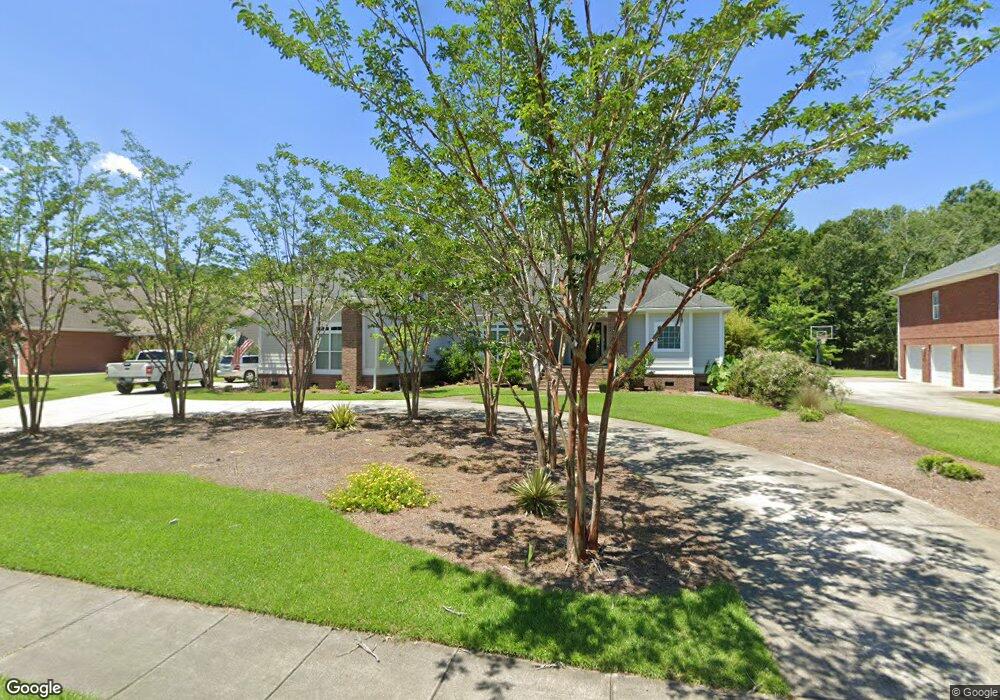
3751 St Ellen's Dr Mount Pleasant, SC 29466
Darrell Creek NeighborhoodEstimated Value: $1,316,361 - $1,542,000
5
Beds
4
Baths
3,456
Sq Ft
$408/Sq Ft
Est. Value
About This Home
This home is located at 3751 St Ellen's Dr, Mount Pleasant, SC 29466 and is currently estimated at $1,410,090, approximately $408 per square foot. 3751 St Ellen's Dr is a home located in Charleston County with nearby schools including Carolina Park Elementary, Thomas C. Cario Middle School, and Wando High School.
Ownership History
Date
Name
Owned For
Owner Type
Purchase Details
Closed on
Oct 28, 2014
Sold by
Kidder Jon F and Kidder Susan M
Bought by
Smith Jonathan S and Smith Anna H
Current Estimated Value
Home Financials for this Owner
Home Financials are based on the most recent Mortgage that was taken out on this home.
Original Mortgage
$496,000
Outstanding Balance
$383,563
Interest Rate
4.26%
Mortgage Type
Future Advance Clause Open End Mortgage
Estimated Equity
$1,026,527
Purchase Details
Closed on
Nov 24, 2004
Sold by
K & M Custom Homes
Bought by
Kidder Jon F and Kidder Susan M
Purchase Details
Closed on
Mar 25, 2004
Sold by
Pipala Richard and Pipala Sheryl
Bought by
K&M Custom Home Builders Llc
Purchase Details
Closed on
Nov 21, 2003
Sold by
Crowne Charleston Associates Lp
Bought by
Pipala Richard and Pipala Sheryl
Purchase Details
Closed on
Feb 24, 2003
Sold by
Dildine Thomas E
Bought by
Charleston Area Regional Transportation
Create a Home Valuation Report for This Property
The Home Valuation Report is an in-depth analysis detailing your home's value as well as a comparison with similar homes in the area
Home Values in the Area
Average Home Value in this Area
Purchase History
| Date | Buyer | Sale Price | Title Company |
|---|---|---|---|
| Smith Jonathan S | $620,000 | -- | |
| Kidder Jon F | $550,000 | -- | |
| K&M Custom Home Builders Llc | $104,320 | -- | |
| Pipala Richard | $61,287 | -- | |
| Charleston Area Regional Transportation | $143,400 | -- |
Source: Public Records
Mortgage History
| Date | Status | Borrower | Loan Amount |
|---|---|---|---|
| Open | Smith Jonathan S | $496,000 |
Source: Public Records
Tax History Compared to Growth
Tax History
| Year | Tax Paid | Tax Assessment Tax Assessment Total Assessment is a certain percentage of the fair market value that is determined by local assessors to be the total taxable value of land and additions on the property. | Land | Improvement |
|---|---|---|---|---|
| 2024 | $2,961 | $26,510 | $0 | $0 |
| 2023 | $2,635 | $26,510 | $0 | $0 |
| 2022 | $2,362 | $25,710 | $0 | $0 |
| 2021 | $2,598 | $25,710 | $0 | $0 |
| 2020 | $2,657 | $25,710 | $0 | $0 |
| 2019 | $2,547 | $24,800 | $0 | $0 |
| 2017 | $2,510 | $24,800 | $0 | $0 |
| 2016 | $2,386 | $24,800 | $0 | $0 |
| 2015 | $2,498 | $24,800 | $0 | $0 |
| 2014 | $159 | $0 | $0 | $0 |
| 2011 | -- | $0 | $0 | $0 |
Source: Public Records
Map
Nearby Homes
- 3751 St Ellens Dr
- 1767 Agate Bay Dr
- 3723 Saint Ellens Dr
- 314 Commonwealth Rd
- 3618 Spindrift Dr
- 1573 Bourne Crossing
- 3517 Crosstrees Ln
- 2196 Beckenham Dr
- 1920 Hubbell Dr
- 1563 Capel St
- 2208 Beckenham Dr
- 3616 Maidstone Dr
- 3269 Beaconsfield Rd
- 2296 Middlesex St
- 2296 Beckenham Dr
- 3261 Beaconsfield Rd
- 3765 Maidstone Dr
- 2254 Beckenham Dr
- 2217 Beckenham Dr
- 1757 Journey Ln Unit 51
- 3747 Saint Ellens Dr
- 3751 Saint Ellens Dr
- 3743 St Ellen's Dr
- 3755 Saint Ellens Dr
- 3755 St Ellen's Dr
- 3762 Saint Ellens Dr
- 3766 St Ellens Dr
- 485 Triple Oak Dr
- 3766 St Ellen's Dr
- 3766 Saint Ellens Dr
- 3770 St Ellen's Dr
- 3770 St Ellens Dr
- 3770 Saint Ellens Dr
- 3739 Saint Ellens Dr
- 3739 St Ellen's Dr
- 3774 Saint Ellens Dr
- 3774 St Ellen's Dr
- 3763 St Ellen's Dr
- 3763 Saint Ellens Dr
- 3763 St Ellens Dr