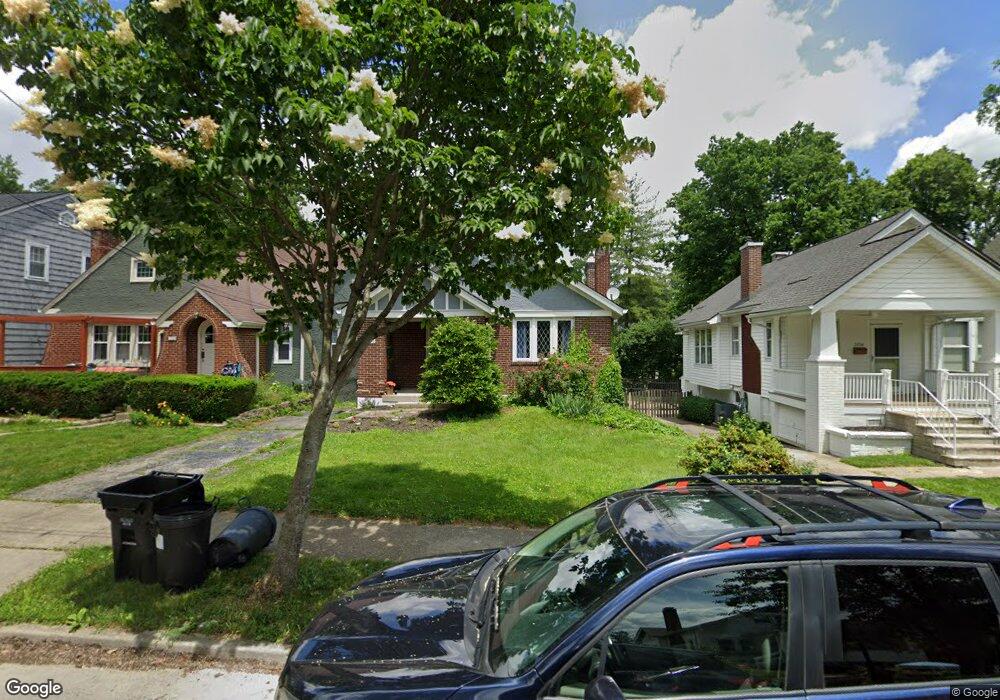
3752 Aylesboro Ave Cincinnati, OH 45208
Hyde Park NeighborhoodEstimated Value: $347,000 - $390,000
2
Beds
1
Bath
917
Sq Ft
$403/Sq Ft
Est. Value
About This Home
This home is located at 3752 Aylesboro Ave, Cincinnati, OH 45208 and is currently estimated at $369,114, approximately $402 per square foot. 3752 Aylesboro Ave is a home located in Hamilton County with nearby schools including Kilgour Elementary School, Clark Montessori High School, and Shroder High School.
Ownership History
Date
Name
Owned For
Owner Type
Purchase Details
Closed on
Oct 23, 2007
Sold by
Reuter Timothy E
Bought by
Giannitelli Janell D
Current Estimated Value
Home Financials for this Owner
Home Financials are based on the most recent Mortgage that was taken out on this home.
Original Mortgage
$174,700
Outstanding Balance
$110,031
Interest Rate
6.38%
Mortgage Type
Unknown
Estimated Equity
$259,083
Purchase Details
Closed on
Aug 22, 2003
Sold by
Smith Jeffrey W
Bought by
Reuter Timothy E
Home Financials for this Owner
Home Financials are based on the most recent Mortgage that was taken out on this home.
Original Mortgage
$140,000
Interest Rate
5.69%
Mortgage Type
Unknown
Purchase Details
Closed on
Mar 5, 2001
Sold by
Annamaria Carrington
Bought by
Smith Jeffrey W
Home Financials for this Owner
Home Financials are based on the most recent Mortgage that was taken out on this home.
Original Mortgage
$125,500
Interest Rate
8%
Create a Home Valuation Report for This Property
The Home Valuation Report is an in-depth analysis detailing your home's value as well as a comparison with similar homes in the area
Home Values in the Area
Average Home Value in this Area
Purchase History
| Date | Buyer | Sale Price | Title Company |
|---|---|---|---|
| Giannitelli Janell D | $184,000 | Advanced Land Title Agency | |
| Reuter Timothy E | $175,000 | -- | |
| Smith Jeffrey W | $159,500 | -- |
Source: Public Records
Mortgage History
| Date | Status | Borrower | Loan Amount |
|---|---|---|---|
| Open | Giannitelli Janell D | $174,700 | |
| Previous Owner | Reuter Timothy E | $140,000 | |
| Previous Owner | Smith Jeffrey W | $125,500 | |
| Closed | Reuter Timothy E | $25,527 |
Source: Public Records
Tax History Compared to Growth
Tax History
| Year | Tax Paid | Tax Assessment Tax Assessment Total Assessment is a certain percentage of the fair market value that is determined by local assessors to be the total taxable value of land and additions on the property. | Land | Improvement |
|---|---|---|---|---|
| 2024 | $5,255 | $88,008 | $52,259 | $35,749 |
| 2023 | $5,374 | $88,008 | $52,259 | $35,749 |
| 2022 | $5,418 | $79,598 | $43,313 | $36,285 |
| 2021 | $5,214 | $79,598 | $43,313 | $36,285 |
| 2020 | $5,367 | $79,598 | $43,313 | $36,285 |
| 2019 | $5,059 | $68,618 | $37,338 | $31,280 |
| 2018 | $5,067 | $68,618 | $37,338 | $31,280 |
| 2017 | $4,813 | $68,618 | $37,338 | $31,280 |
| 2016 | $4,819 | $67,754 | $34,451 | $33,303 |
| 2015 | $4,345 | $67,754 | $34,451 | $33,303 |
| 2014 | $4,376 | $67,754 | $34,451 | $33,303 |
| 2013 | $4,085 | $62,157 | $31,605 | $30,552 |
Source: Public Records
Map
Nearby Homes
- 3744 Aylesboro Ave
- 3668 Wilshire Ave
- 3630 Bellecrest Ave
- 3646 Ashworth Dr
- 3713 Erie Ave
- 3641 Brentwood Ave
- 3538 Forestoak Ct
- 3474 Forestoak Ct
- 3529 Pembroke Ave
- 25 Observatory Hill
- 3460 Custer Ave
- 3425 Pape Ave
- 19 Greenhouse Ln
- 3525 Deepwoods Ln
- 3614 Marburg Ave
- 3458 Observatory Place
- 4422 Canyon Oak Ct
- 4418 Canyon Oak Ct
- 2947 Iron Oak Ln
- 3508 Tarpis Ave
- 3748 Aylesboro Ave
- 3756 Aylesboro Ave
- 3764 Aylesboro Ave
- 3766 Aylesboro Ave
- 3742 Aylesboro Ave
- 3689 Saybrook Ave
- 3693 Saybrook Ave
- 3687 Saybrook Ave
- 3770 Aylesboro Ave
- 3685 Saybrook Ave
- 3738 Aylesboro Ave
- 3695 Saybrook Ave
- 3751 Aylesboro Ave
- 3743 Aylesboro Ave
- 3697 Saybrook Ave
- 3767 Aylesboro Ave
- 3774 Aylesboro Ave
- 3741 Aylesboro Ave
- 3734 Aylesboro Ave
- 3769 Aylesboro Ave