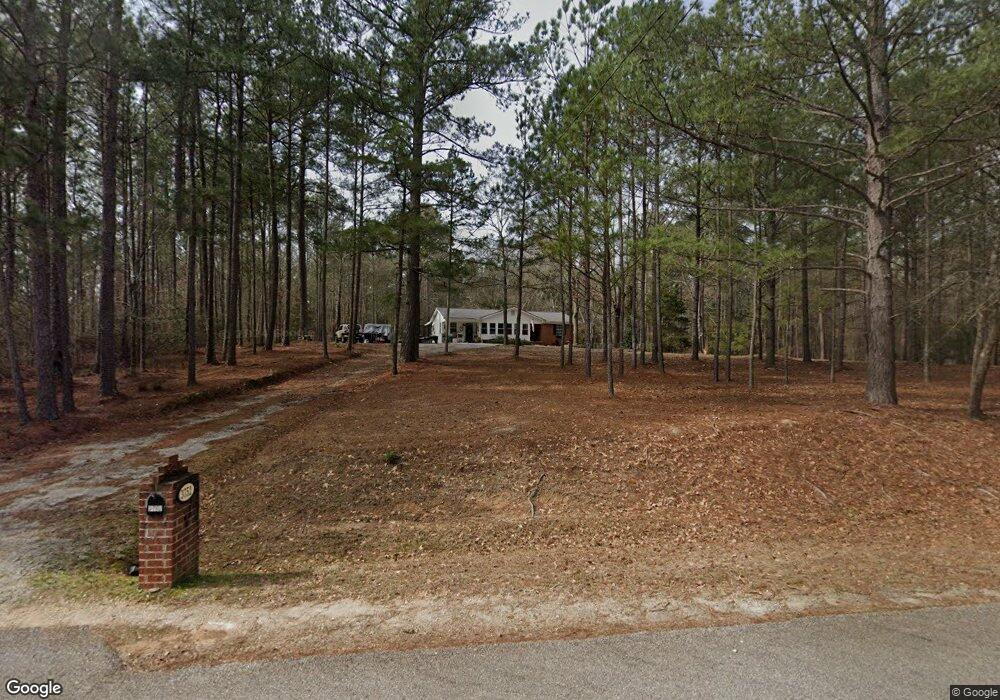
3752 Burns Rd Appling, GA 30802
Estimated Value: $243,331 - $306,000
2
Beds
1
Bath
1,426
Sq Ft
$185/Sq Ft
Est. Value
About This Home
This home is located at 3752 Burns Rd, Appling, GA 30802 and is currently estimated at $263,583, approximately $184 per square foot. 3752 Burns Rd is a home located in Columbia County with nearby schools including North Columbia Elementary School, Greenbrier Middle School, and Greenbrier High School.
Ownership History
Date
Name
Owned For
Owner Type
Purchase Details
Closed on
Jan 16, 2008
Sold by
Traylor Lena M
Bought by
Suggs Rene
Current Estimated Value
Home Financials for this Owner
Home Financials are based on the most recent Mortgage that was taken out on this home.
Original Mortgage
$122,000
Outstanding Balance
$76,848
Interest Rate
6.12%
Mortgage Type
New Conventional
Estimated Equity
$186,735
Purchase Details
Closed on
Mar 2, 2007
Sold by
Johnson Tennyson Charles
Bought by
Traylor Lena M
Home Financials for this Owner
Home Financials are based on the most recent Mortgage that was taken out on this home.
Original Mortgage
$114,855
Interest Rate
9.63%
Mortgage Type
New Conventional
Purchase Details
Closed on
Nov 30, 2005
Sold by
Bank Of America Na
Bought by
Johnson Tennyson
Create a Home Valuation Report for This Property
The Home Valuation Report is an in-depth analysis detailing your home's value as well as a comparison with similar homes in the area
Purchase History
| Date | Buyer | Sale Price | Title Company |
|---|---|---|---|
| Suggs Rene | $122,000 | -- | |
| Traylor Lena M | $120,900 | -- | |
| Johnson Tennyson | $19,900 | -- |
Source: Public Records
Mortgage History
| Date | Status | Borrower | Loan Amount |
|---|---|---|---|
| Open | Suggs Rene | $122,000 | |
| Previous Owner | Traylor Lena M | $114,855 |
Source: Public Records
Tax History
| Year | Tax Paid | Tax Assessment Tax Assessment Total Assessment is a certain percentage of the fair market value that is determined by local assessors to be the total taxable value of land and additions on the property. | Land | Improvement |
|---|---|---|---|---|
| 2025 | $1,419 | $99,542 | $25,903 | $73,639 |
| 2024 | $1,056 | $82,296 | $20,113 | $62,183 |
| 2023 | $300 | $69,410 | $10,529 | $58,881 |
| 2022 | $1,777 | $68,413 | $10,529 | $57,884 |
| 2021 | $1,647 | $60,634 | $10,529 | $50,105 |
| 2020 | $1,659 | $59,795 | $10,130 | $49,665 |
| 2019 | $1,595 | $57,500 | $10,130 | $47,370 |
| 2018 | $1,569 | $56,375 | $10,329 | $46,046 |
| 2017 | $1,577 | $56,440 | $10,329 | $46,111 |
| 2016 | $1,366 | $50,701 | $8,158 | $42,543 |
| 2015 | $1,344 | $49,820 | $8,158 | $41,662 |
| 2014 | $1,339 | $49,000 | $7,758 | $41,242 |
Source: Public Records
Map
Nearby Homes
- 850 Captain John Brown Rd
- 5332 Linder McCurdy Rd
- 0 Dent Rd
- 0 Linder McCurdy Rd
- 5601 Burks Mountain Rd Unit 12
- 5454 Washington Rd
- 5494 Washington Rd
- 478 Bonaventure Way
- 5530 Tubman Rd
- 721 Pretoria Dr
- 4027 Dewaal St
- 4025 Dewaal St
- 4076 Dewaal St
- Tbd Dew Drop Inn Rd
- 4121 Pine Ridge Rd
- 810 Glencoe Way
- 520 Jutland Way
- 305 Buxton Ln
- 510 Jutland Way
- 919 Pennington Way
Your Personal Tour Guide
Ask me questions while you tour the home.