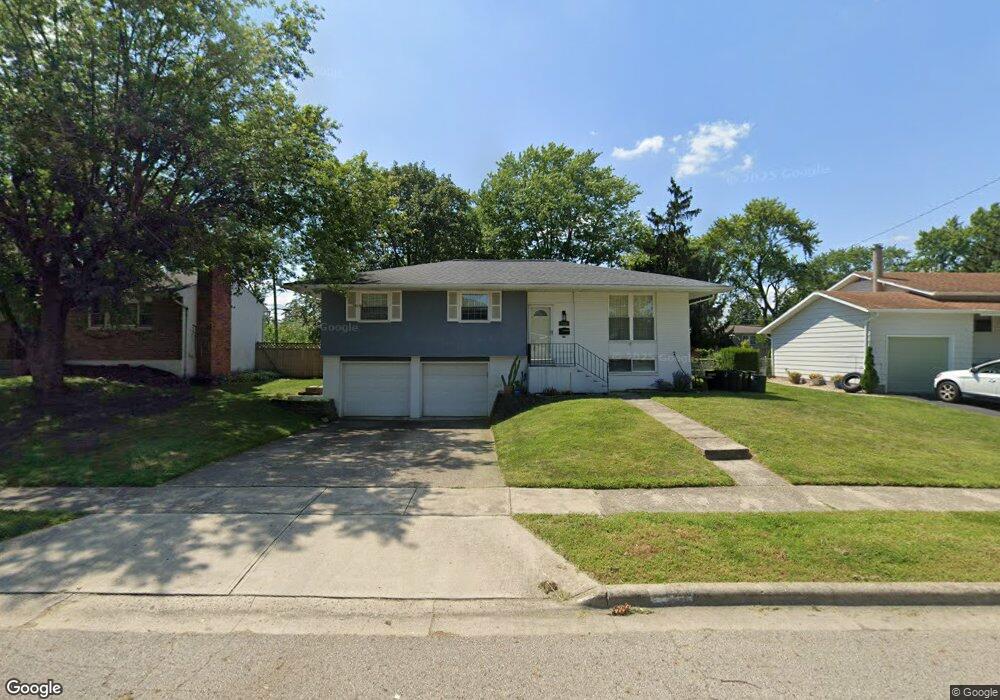
3753 Capistrano Way Grove City, OH 43123
Estimated Value: $280,000 - $296,166
3
Beds
2
Baths
1,776
Sq Ft
$161/Sq Ft
Est. Value
About This Home
This home is located at 3753 Capistrano Way, Grove City, OH 43123 and is currently estimated at $286,792, approximately $161 per square foot. 3753 Capistrano Way is a home located in Franklin County with nearby schools including Monterey Elementary School, Park Street Intermediate School, and Grove City High School.
Ownership History
Date
Name
Owned For
Owner Type
Purchase Details
Closed on
Oct 17, 2002
Sold by
Lively Michael E and Lively Pamela D
Bought by
Lehotay Iola M and Hagar Bobbi J
Current Estimated Value
Home Financials for this Owner
Home Financials are based on the most recent Mortgage that was taken out on this home.
Original Mortgage
$123,018
Outstanding Balance
$51,650
Interest Rate
6.18%
Mortgage Type
FHA
Estimated Equity
$235,142
Purchase Details
Closed on
Jul 21, 1999
Sold by
Wilson Ritchie L and Wilson Nancy A
Bought by
Lively Michael E and Lively Pamela D
Home Financials for this Owner
Home Financials are based on the most recent Mortgage that was taken out on this home.
Original Mortgage
$106,998
Interest Rate
7.54%
Mortgage Type
VA
Purchase Details
Closed on
Sep 28, 1977
Bought by
Wilson Ritchie L
Create a Home Valuation Report for This Property
The Home Valuation Report is an in-depth analysis detailing your home's value as well as a comparison with similar homes in the area
Home Values in the Area
Average Home Value in this Area
Purchase History
| Date | Buyer | Sale Price | Title Company |
|---|---|---|---|
| Lehotay Iola M | $124,000 | Chicago Title | |
| Lively Michael E | $104,900 | Independent Title | |
| Wilson Ritchie L | -- | -- |
Source: Public Records
Mortgage History
| Date | Status | Borrower | Loan Amount |
|---|---|---|---|
| Open | Lehotay Iola M | $123,018 | |
| Previous Owner | Lively Michael E | $106,998 |
Source: Public Records
Tax History Compared to Growth
Tax History
| Year | Tax Paid | Tax Assessment Tax Assessment Total Assessment is a certain percentage of the fair market value that is determined by local assessors to be the total taxable value of land and additions on the property. | Land | Improvement |
|---|---|---|---|---|
| 2024 | $4,054 | $89,150 | $26,040 | $63,110 |
| 2023 | $3,997 | $89,145 | $26,040 | $63,105 |
| 2022 | $3,221 | $52,820 | $10,850 | $41,970 |
| 2021 | $3,283 | $52,820 | $10,850 | $41,970 |
| 2020 | $3,273 | $52,820 | $10,850 | $41,970 |
| 2019 | $2,910 | $43,580 | $9,030 | $34,550 |
| 2018 | $2,917 | $43,580 | $9,030 | $34,550 |
| 2017 | $2,911 | $43,580 | $9,030 | $34,550 |
| 2016 | $2,933 | $40,470 | $9,140 | $31,330 |
| 2015 | $2,934 | $40,470 | $9,140 | $31,330 |
| 2014 | $2,936 | $40,470 | $9,140 | $31,330 |
| 2013 | $1,386 | $40,460 | $9,135 | $31,325 |
Source: Public Records
Map
Nearby Homes
- 3660 Brinkman Dr
- 3687 Homecomer Dr
- 3910 Security Dr
- 3815 Queen Anne Place Unit B19
- 2974 Carol Ave
- 3828 Queen Anne Place Unit B8
- 3830 Queen Anne Place Unit A9
- 2545 Scott Ct
- 3474 Highland St
- 3454 Independence St
- 3542 Hoover Rd
- 2430 Sportsman Dr
- 3449 Liberty St
- 3429 Devin Rd
- 3944 Girbert St
- 2421 Yates Ave
- 3333 Tareyton Dr
- 4236 Maplegrove Dr
- 3267 Castleton St
- 3163 Gunderman Ave
- 3743 Capistrano Way
- 3763 Capistrano Way
- 3744 Christopher Place
- 3733 Capistrano Way
- 3736 Christopher Place
- 3775 Capistrano Way
- 2708 Dennis Ln
- 3752 Capistrano Way
- 3744 Capistrano Way
- 3748 Christopher Place
- 3762 Capistrano Way
- 3723 Capistrano Way
- 3728 Christopher Place
- 3736 Capistrano Way
- 2718 Dennis Ln
- 3776 Capistrano Way
- 3728 Capistrano Way
- 2672 Dennis Ln
- 2728 Dennis Ln
- 3720 Christopher Place