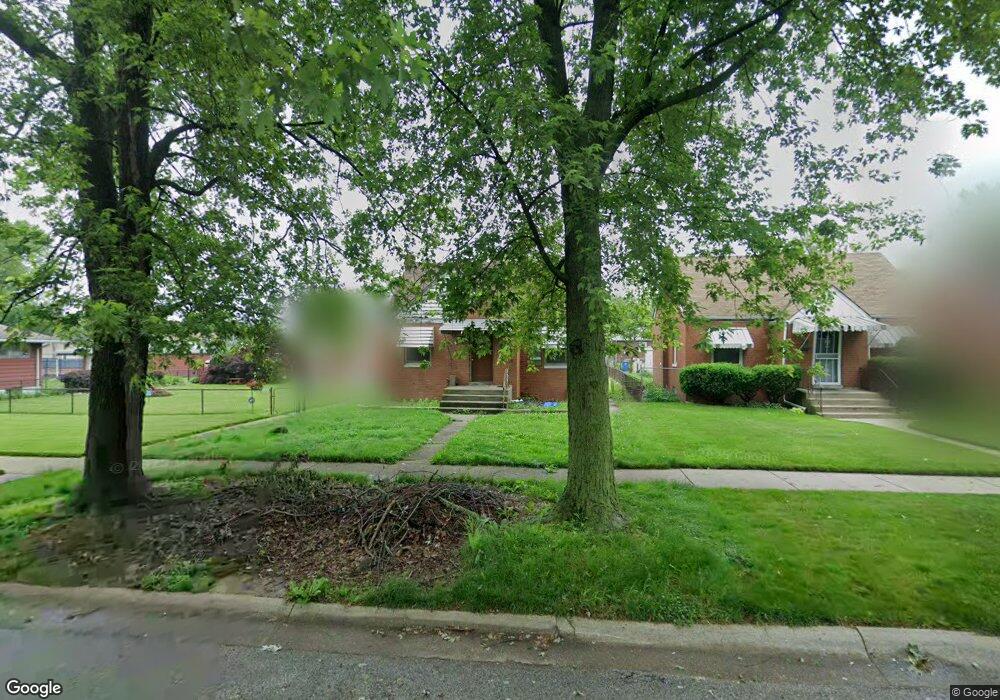
3753 Fillmore St Gary, IN 46408
Glen Park NeighborhoodEstimated Value: $53,000 - $171,000
3
Beds
1
Bath
2,310
Sq Ft
$48/Sq Ft
Est. Value
About This Home
This home is located at 3753 Fillmore St, Gary, IN 46408 and is currently estimated at $111,854, approximately $48 per square foot. 3753 Fillmore St is a home located in Lake County with nearby schools including Glen Park Academy for Excellence in Learning, Bailly Preparatory Academy, and West Side Leadership Academy.
Ownership History
Date
Name
Owned For
Owner Type
Purchase Details
Closed on
Apr 4, 2025
Sold by
Trejo Monica Garcia and Garcia Monica
Bought by
J And M Garcia Property Trust and Sandoval
Current Estimated Value
Purchase Details
Closed on
Apr 12, 2022
Sold by
Bernard Bohanon
Bought by
Garcia Monica
Purchase Details
Closed on
Apr 8, 2022
Sold by
Bernard Bohanon
Bought by
Garcia Monica
Purchase Details
Closed on
Apr 5, 2022
Sold by
Bohanon Bernard
Bought by
Garcia Monica
Purchase Details
Closed on
Nov 29, 2021
Sold by
Estella Bohanon
Bought by
Bohanon Bernard
Purchase Details
Closed on
Apr 24, 2019
Sold by
E & A Investments
Bought by
Bohanon Estella
Purchase Details
Closed on
Mar 16, 2017
Sold by
Taylor Karlysa C and Taylor Karlyusa
Bought by
E And A Investments
Purchase Details
Closed on
Jun 14, 2013
Sold by
Hard Midalia
Bought by
Taylor Karlysa C
Create a Home Valuation Report for This Property
The Home Valuation Report is an in-depth analysis detailing your home's value as well as a comparison with similar homes in the area
Home Values in the Area
Average Home Value in this Area
Purchase History
| Date | Buyer | Sale Price | Title Company |
|---|---|---|---|
| J And M Garcia Property Trust | -- | None Listed On Document | |
| Garcia Monica | -- | Drake Andrew R | |
| Garcia Monica | -- | Drake Andrew R | |
| Garcia Monica | -- | Drake Andrew R | |
| Bohanon Bernard | -- | None Listed On Document | |
| Bohanon Estella | -- | None Available | |
| E And A Investments | -- | None Available | |
| Taylor Karlysa C | $1,553 | Indiana Title Network Co |
Source: Public Records
Tax History
| Year | Tax Paid | Tax Assessment Tax Assessment Total Assessment is a certain percentage of the fair market value that is determined by local assessors to be the total taxable value of land and additions on the property. | Land | Improvement |
|---|---|---|---|---|
| 2025 | $897 | $75,300 | $5,400 | $69,900 |
| 2024 | $2,769 | $31,800 | $5,400 | $26,400 |
| 2023 | $977 | $31,400 | $5,200 | $26,200 |
| 2022 | $977 | $38,000 | $4,100 | $33,900 |
| 2021 | $913 | $35,500 | $4,100 | $31,400 |
| 2020 | $874 | $34,000 | $4,100 | $29,900 |
| 2019 | $862 | $29,500 | $4,100 | $25,400 |
| 2018 | $934 | $31,300 | $4,300 | $27,000 |
| 2017 | $793 | $31,700 | $4,300 | $27,400 |
| 2016 | $794 | $37,100 | $4,300 | $32,800 |
| 2014 | $918 | $39,100 | $5,000 | $34,100 |
| 2013 | $369 | $38,500 | $5,000 | $33,500 |
Source: Public Records
Map
Nearby Homes
- 3756 Tyler St
- 3752 Tyler St
- 3679 Buchanan St
- 1301 W Ridge Rd
- 3940 Pierce St
- 3816 Lincoln St
- 3771 Van Buren St
- 4151 Harrison St
- 3634 Van Buren St
- 3636 Lincoln St
- 4034 Fillmore St
- 3701 Grant St
- 519 W 39th Ave
- 3916 Monroe St
- 3701 Monroe St
- 3953 Monroe St
- 3980 Madison St
- 3992 Madison St
- 4181 Fillmore St
- 1645 W 40th Ave
- 3751 Fillmore St
- 3759 Fillmore St
- 3767 Fillmore St
- 3775 Fillmore St
- 3752 Polk St
- 3758 Polk St
- 3746 Polk St
- 3740 Polk St
- 3727 Fillmore St
- 3768 Polk St
- 3785 Fillmore St
- 3760 Fillmore St
- 3752 Fillmore St
- 3730 Polk St
- 3744 Fillmore St
- 3770 Fillmore St
- 3776 Polk St
- 3740 Fillmore St
- 3776 Fillmore St
- 3795 Fillmore St
Your Personal Tour Guide
Ask me questions while you tour the home.