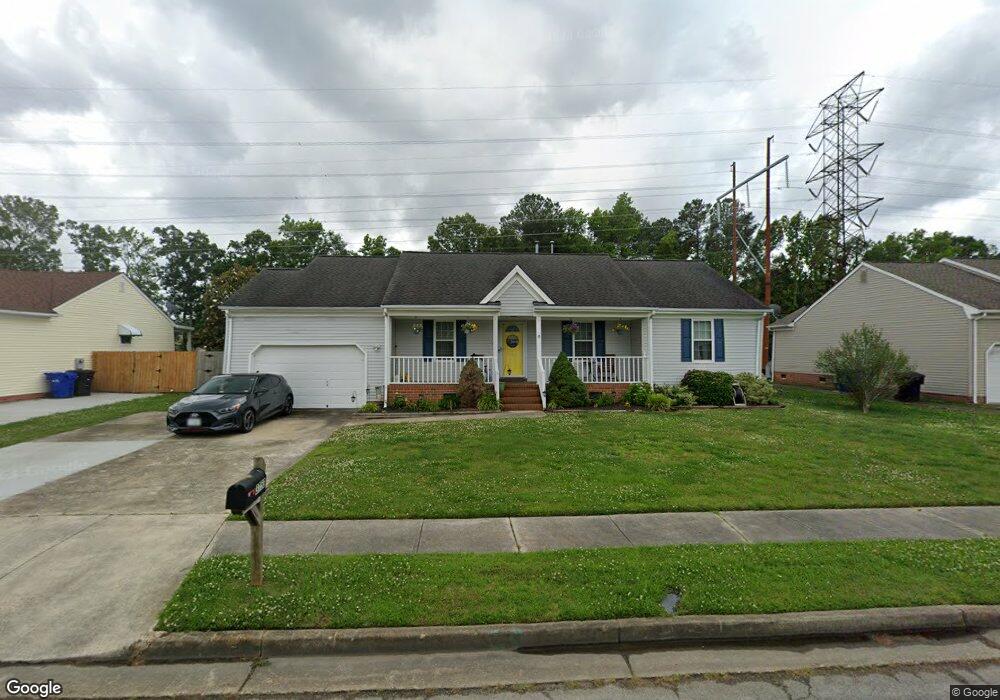
3753 Lilac Dr Portsmouth, VA 23703
Churchland NeighborhoodEstimated Value: $335,811 - $358,000
3
Beds
2
Baths
1,490
Sq Ft
$233/Sq Ft
Est. Value
About This Home
This home is located at 3753 Lilac Dr, Portsmouth, VA 23703 and is currently estimated at $346,953, approximately $232 per square foot. 3753 Lilac Dr is a home located in Portsmouth City with nearby schools including Churchland Elementary School, Churchland Academy Elementary School, and Churchland Middle School.
Ownership History
Date
Name
Owned For
Owner Type
Purchase Details
Closed on
Mar 29, 2024
Sold by
Deaton Rachel
Bought by
Tyson Haley and Tyson Dwight
Current Estimated Value
Home Financials for this Owner
Home Financials are based on the most recent Mortgage that was taken out on this home.
Original Mortgage
$320,230
Outstanding Balance
$314,871
Interest Rate
6.9%
Mortgage Type
VA
Estimated Equity
$32,082
Purchase Details
Closed on
Jun 15, 2020
Sold by
Williams Mary Ellen
Bought by
Deaton Rachel
Home Financials for this Owner
Home Financials are based on the most recent Mortgage that was taken out on this home.
Original Mortgage
$240,916
Interest Rate
3.2%
Mortgage Type
VA
Purchase Details
Closed on
Sep 14, 2016
Sold by
Bruce Elvin G and Bruce Christine M
Bought by
Williams Mary Ellen
Home Financials for this Owner
Home Financials are based on the most recent Mortgage that was taken out on this home.
Original Mortgage
$209,407
Interest Rate
3.43%
Mortgage Type
VA
Create a Home Valuation Report for This Property
The Home Valuation Report is an in-depth analysis detailing your home's value as well as a comparison with similar homes in the area
Home Values in the Area
Average Home Value in this Area
Purchase History
| Date | Buyer | Sale Price | Title Company |
|---|---|---|---|
| Tyson Haley | $310,000 | Fidelity National Title | |
| Deaton Rachel | $235,500 | Liberty Title & Escrow Co | |
| Williams Mary Ellen | $205,000 | Advance Title & Abstract |
Source: Public Records
Mortgage History
| Date | Status | Borrower | Loan Amount |
|---|---|---|---|
| Open | Tyson Haley | $320,230 | |
| Previous Owner | Deaton Rachel | $240,916 | |
| Previous Owner | Williams Mary Ellen | $209,407 |
Source: Public Records
Tax History Compared to Growth
Tax History
| Year | Tax Paid | Tax Assessment Tax Assessment Total Assessment is a certain percentage of the fair market value that is determined by local assessors to be the total taxable value of land and additions on the property. | Land | Improvement |
|---|---|---|---|---|
| 2025 | $3,736 | $305,390 | $82,880 | $222,510 |
| 2024 | $3,736 | $303,730 | $82,880 | $220,850 |
| 2023 | $3,380 | $270,420 | $82,880 | $187,540 |
| 2022 | $3,249 | $249,930 | $69,060 | $180,870 |
| 2021 | $2,972 | $228,650 | $56,100 | $172,550 |
| 2020 | $2,938 | $225,980 | $53,430 | $172,550 |
| 2019 | $2,829 | $217,650 | $53,430 | $164,220 |
| 2018 | $2,829 | $217,650 | $53,430 | $164,220 |
| 2017 | $2,721 | $209,320 | $53,430 | $155,890 |
| 2016 | $2,471 | $190,090 | $52,360 | $137,730 |
| 2015 | $2,471 | $190,090 | $52,360 | $137,730 |
| 2014 | $2,414 | $190,090 | $52,360 | $137,730 |
Source: Public Records
Map
Nearby Homes
- 5300 Larkspur Rd
- 3604 Lilac Dr
- 10AC Cedar Ln
- 5516 Bingham Dr
- 3315 Camellia Dr
- 4008 Oakhurst Rd
- 5806 Fawkes St
- 4959 Briarwood Ln
- 4955 Briarwood Ln
- 3433 Willow Breeze Dr
- 3616 Bowden St
- 5911 Dunkirk St
- 6002 Campbell St
- 6015 Arthur Ave
- 5807 Dunkin St
- 3432 Carter Rd
- 4028 Swannanoa Dr
- 3509 Spence Rd
- 6205 Dunkirk St
- 3604 Pierce St
- 3749 Lilac Dr
- 3757 Lilac Dr
- 3761 Lilac Dr
- 3745 Lilac Dr
- 3628 Hosiers Oaks Dr
- 3748 Lilac Dr
- 3632 Hosiers Oaks Dr
- 3752 Lilac Dr
- 1 Savage Ct
- 3 Savage Ct
- 3765 Lilac Dr
- 5401 Lilac Crescent
- 3741 Lilac Dr
- 3636 Hosiers Oaks Dr
- 3756 Lilac Dr
- 5421 Lilac Crescent
- 5417 Lilac Crescent
- 3769 Lilac Dr
- 3737 Lilac Dr
- 5425 Lilac Crescent