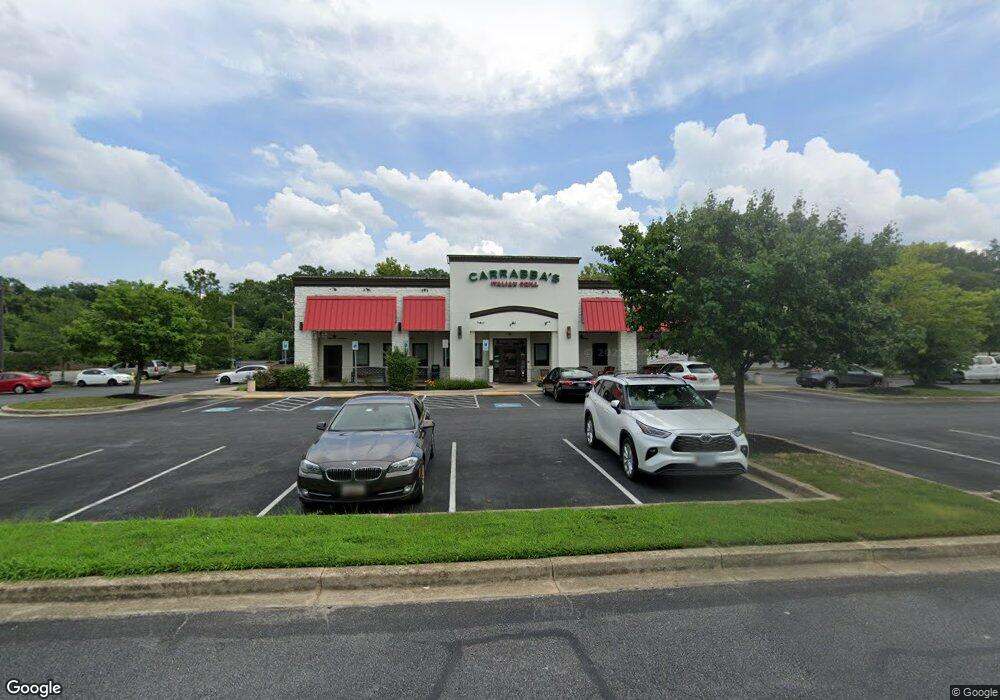
3754 Crain Hwy Waldorf, MD 20603
Estimated Value: $7,278,182
--
Bed
--
Bath
5,977
Sq Ft
$1,218/Sq Ft
Est. Value
About This Home
This home is located at 3754 Crain Hwy, Waldorf, MD 20603 and is currently estimated at $7,278,182, approximately $1,217 per square foot. 3754 Crain Hwy is a home located in Charles County with nearby schools including Arthur Middleton Elementary School, John Hanson Middle School, and St. Charles High School.
Ownership History
Date
Name
Owned For
Owner Type
Purchase Details
Closed on
Mar 14, 2012
Sold by
Private Restaurant Properties Llc
Bought by
National Retail Properties Lp
Current Estimated Value
Purchase Details
Closed on
Jun 27, 2007
Sold by
Os Realty Inc
Bought by
Private Restaurant Properties Llc
Purchase Details
Closed on
Jun 14, 2007
Sold by
Os Realty Inc
Bought by
Private Restaurant Properties Llc
Purchase Details
Closed on
Aug 25, 2006
Sold by
Waldorf Hotel Partners Two Llc
Bought by
Realty Inc
Purchase Details
Closed on
Aug 16, 2006
Sold by
Waldorf Hotel Partners Two Llc
Bought by
Realty Inc
Purchase Details
Closed on
Dec 8, 2004
Sold by
Waldorf Hotel Partners Llc
Bought by
Waldorf Hotel Partners Two Llc
Purchase Details
Closed on
Dec 6, 2004
Sold by
Waldorf Hotel Partners Llc
Bought by
Waldorf Hotel Partners Two Llc
Purchase Details
Closed on
Mar 20, 2000
Sold by
Ludwig Jeffrey
Bought by
Waldorf Hotel Partners Llc
Create a Home Valuation Report for This Property
The Home Valuation Report is an in-depth analysis detailing your home's value as well as a comparison with similar homes in the area
Home Values in the Area
Average Home Value in this Area
Purchase History
| Date | Buyer | Sale Price | Title Company |
|---|---|---|---|
| National Retail Properties Lp | $3,643,312 | Chicago Title Insurance Co | |
| Private Restaurant Properties Llc | $2,600,000 | -- | |
| Private Restaurant Properties Llc | $2,600,000 | -- | |
| Realty Inc | $775,000 | -- | |
| Realty Inc | $775,000 | -- | |
| Waldorf Hotel Partners Two Llc | $600,000 | -- | |
| Waldorf Hotel Partners Two Llc | $600,000 | -- | |
| Waldorf Hotel Partners Llc | $309,897 | -- |
Source: Public Records
Tax History Compared to Growth
Tax History
| Year | Tax Paid | Tax Assessment Tax Assessment Total Assessment is a certain percentage of the fair market value that is determined by local assessors to be the total taxable value of land and additions on the property. | Land | Improvement |
|---|---|---|---|---|
| 2025 | $123,743 | $4,644,000 | $787,900 | $3,856,100 |
| 2024 | $62,304 | $4,706,300 | $787,900 | $3,918,400 |
| 2023 | $56,230 | $3,934,933 | $0 | $0 |
| 2022 | $41,938 | $3,163,567 | $0 | $0 |
| 2021 | $36,192 | $2,392,200 | $787,900 | $1,604,300 |
| 2020 | $36,192 | $2,725,500 | $787,900 | $1,937,600 |
| 2019 | $36,223 | $3,257,933 | $0 | $0 |
| 2018 | $42,972 | $3,244,300 | $787,900 | $2,456,400 |
| 2017 | $36,190 | $2,731,967 | $0 | $0 |
| 2016 | -- | $2,219,633 | $0 | $0 |
| 2015 | $21,713 | $1,707,300 | $0 | $0 |
| 2014 | $21,713 | $1,707,300 | $0 | $0 |
Source: Public Records
Map
Nearby Homes
- 110 Sherman Rd
- 93 Garner Ave
- 139 Garner Ave
- 1205 Adams Ct
- 52 Garner Ave
- 1115 Hamlin Rd
- 10871 Finsbury Alley
- 5612 Needlefish Ct
- 221 Brent Rd
- 213 Acadia Rd
- 0 Smallwood Dr Unit MDCH2031694
- 531 Garner Ave
- 228 Garner Ave
- 1016 Stone Ave
- 5416 Harvest Fish Place
- 790 University Dr
- 5007 Manta Ct
- 302 Barksdale Ave
- 5847 Calypso Ct
- 3850 Shark Ct
- 3750 Crain Hwy
- 3742 Crain Hwy
- 3746 Crain Hwy
- 3785 Old Washington Rd
- 3811 Old Washington Rd
- 3817 Old Washington Rd
- 3805 Old Washington Rd
- 3799 Old Washington Rd
- 3831 Old Washington Rd
- 3791 Old Washington Rd
- 3847 Old Washington Rd
- 3841 Old Washington Rd
- 3775 Old Washington Rd
- 3851 Old Washington Rd
- 3798 Old Washington Rd
- 3790 Old Washington Rd
- 3763 Old Washington Rd
- 3804 Old Washington Rd
- 3822 Old Washington Rd
- 3857 Old Washington Rd