Estimated Value: $78,000 - $108,000
1
Bed
1
Bath
630
Sq Ft
$146/Sq Ft
Est. Value
About This Home
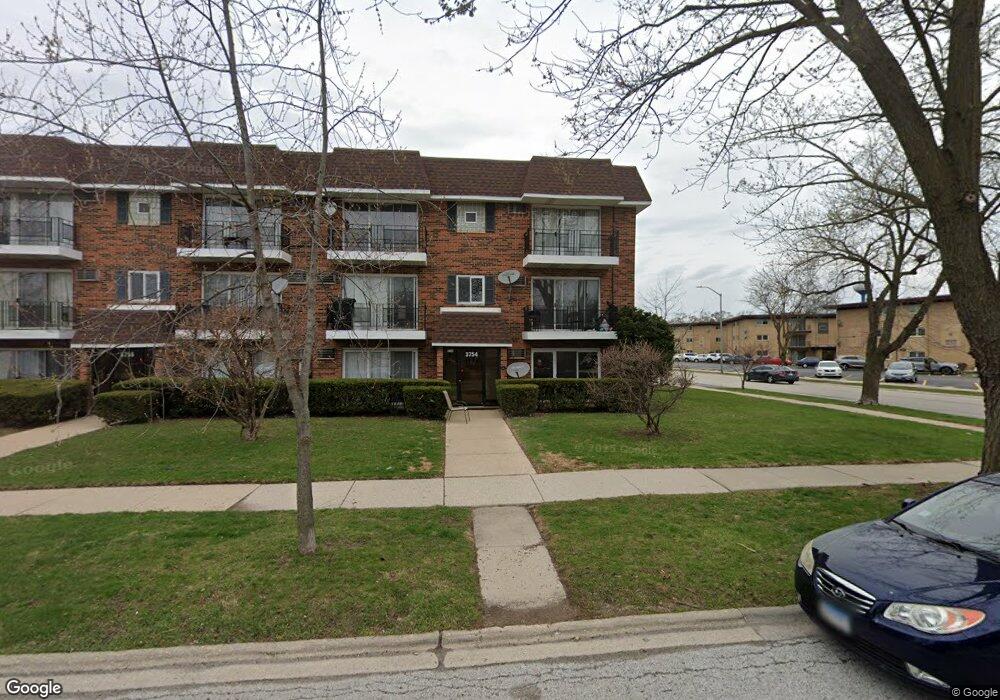
This home is located at 3754 W 120th St Unit 1C, Alsip, IL 60803 and is currently estimated at $92,000, approximately $146 per square foot. 3754 W 120th St Unit 1C is a home located in Cook County with nearby schools including Lawn Manor School, Meadow Lane School, and Hamlin Upper Grade Center.
Ownership History
Date
Name
Owned For
Owner Type
Purchase Details
Closed on
May 13, 2020
Sold by
Grogan Michael
Bought by
Division Property Llc
Current Estimated Value
Purchase Details
Closed on
Feb 8, 2007
Sold by
Sz Development Corp
Bought by
Grogan Michael
Home Financials for this Owner
Home Financials are based on the most recent Mortgage that was taken out on this home.
Original Mortgage
$67,500
Interest Rate
6.23%
Mortgage Type
Purchase Money Mortgage
Purchase Details
Closed on
Dec 15, 2006
Sold by
Sz Development Corp
Bought by
Rodriguez Deborah
Home Financials for this Owner
Home Financials are based on the most recent Mortgage that was taken out on this home.
Original Mortgage
$67,500
Interest Rate
6.23%
Mortgage Type
Purchase Money Mortgage
Purchase Details
Closed on
Jun 21, 2005
Sold by
Zacharski Stanislaw
Bought by
Zacharski Stanislaw and Zacharski Zofia
Create a Home Valuation Report for This Property
The Home Valuation Report is an in-depth analysis detailing your home's value as well as a comparison with similar homes in the area
Home Values in the Area
Average Home Value in this Area
Purchase History
| Date | Buyer | Sale Price | Title Company |
|---|---|---|---|
| Division Property Llc | $39,500 | None Available | |
| Grogan Michael | $75,000 | None Available | |
| Rodriguez Deborah | $75,000 | None Available | |
| Zacharski Stanislaw | -- | -- |
Source: Public Records
Mortgage History
| Date | Status | Borrower | Loan Amount |
|---|---|---|---|
| Previous Owner | Grogan Michael | $67,500 | |
| Previous Owner | Rodriguez Deborah | $75,000 |
Source: Public Records
Tax History Compared to Growth
Tax History
| Year | Tax Paid | Tax Assessment Tax Assessment Total Assessment is a certain percentage of the fair market value that is determined by local assessors to be the total taxable value of land and additions on the property. | Land | Improvement |
|---|---|---|---|---|
| 2024 | $1,791 | $5,322 | $628 | $4,694 |
| 2023 | $1,594 | $5,322 | $628 | $4,694 |
| 2022 | $1,594 | $3,922 | $828 | $3,094 |
| 2021 | $1,526 | $3,921 | $827 | $3,094 |
| 2020 | $316 | $3,921 | $827 | $3,094 |
| 2019 | $1,155 | $6,331 | $742 | $5,589 |
| 2018 | $1,113 | $6,331 | $742 | $5,589 |
| 2017 | $1,141 | $6,331 | $742 | $5,589 |
| 2016 | $154 | $2,883 | $628 | $2,255 |
| 2015 | $101 | $2,883 | $628 | $2,255 |
| 2014 | $119 | $2,883 | $628 | $2,255 |
| 2013 | $426 | $3,864 | $628 | $3,236 |
Source: Public Records
Map
Nearby Homes
- 3754 W 120th St Unit 2D
- 11809 S Millard Ave
- 3609 W 121st St
- 12211 S Harding Ave
- 3820 W 117th St
- 11700 S Springfield Ave
- 3735 W 116th Place
- 11800 S Komensky Ave Unit 203
- 3823 W 123rd St Unit 302
- 3821 W 123rd St Unit 301
- 11801 S Karlov Ave Unit 303
- 11824 S Karlov Ave
- 3909 W 123rd St Unit 205A
- 11750 S Homan Ave Unit J
- 11749 S Karlov Ave
- 11720 S Komensky Ave
- 3836 W 115th Place
- 11551 S Komensky Ave
- 11811 S Tripp Ave
- 3416 W 124th St
- 3756 W 120th St Unit 37562B
- 3756 W 120th St Unit 37561B
- 3754 W 120th St Unit 37541D
- 3754 W 120th St Unit 37541C
- 3754 W 120th St Unit 37542C
- 3754 W 120th St Unit 37542D
- 3754 W 120th St Unit 37543D
- 3754 W 120th St Unit 37543C
- 3756 W 120th St Unit 37563B
- 3756 W 120th St Unit 37563A
- 3756 W 120th St Unit 37562A
- 3756 W 120th St Unit 37561A
- 3754 W 120th St Unit 3D
- 3756 W 120th St Unit 2B
- 3756 W 120th St Unit 1B
- 3756 W 120th St Unit 3A
- 11946 S Ridgeway Ave Unit 9463
- 11946 S Ridgeway Ave Unit 9463
- 11946 S Ridgeway Ave Unit 9461
- 11946 S Ridgeway Ave Unit 9462