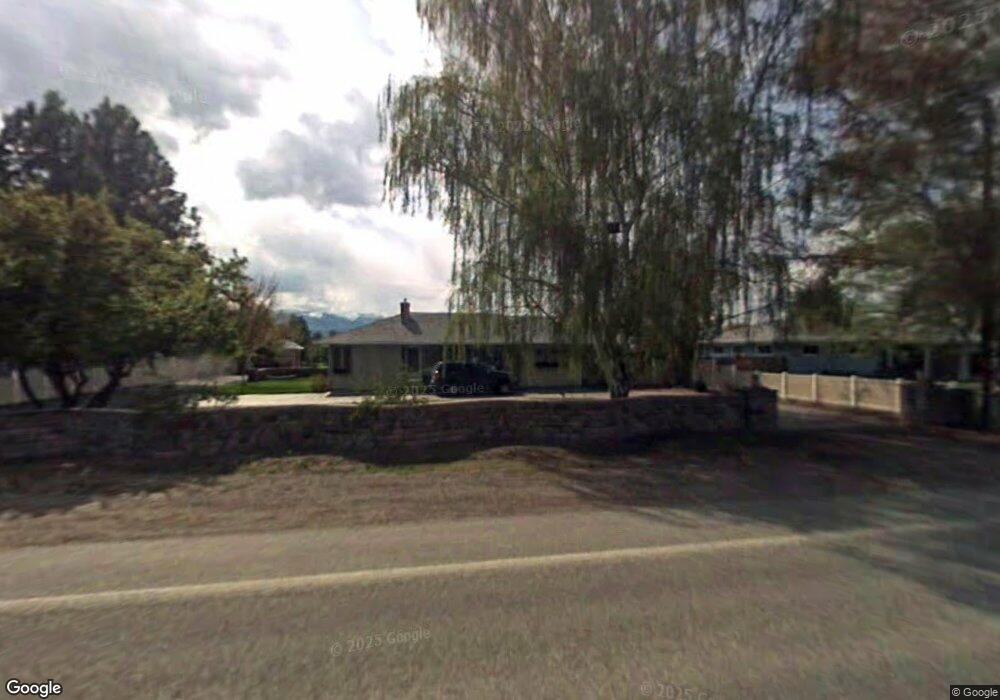
3755 Cedar St Baker City, OR 97814
Estimated Value: $476,102 - $650,000
3
Beds
2
Baths
3,313
Sq Ft
$166/Sq Ft
Est. Value
About This Home
This home is located at 3755 Cedar St, Baker City, OR 97814 and is currently estimated at $549,776, approximately $165 per square foot. 3755 Cedar St is a home located in Baker County with nearby schools including Brooklyn Primary School, Baker Middle School, and Baker High School.
Create a Home Valuation Report for This Property
The Home Valuation Report is an in-depth analysis detailing your home's value as well as a comparison with similar homes in the area
Home Values in the Area
Average Home Value in this Area
Tax History Compared to Growth
Tax History
| Year | Tax Paid | Tax Assessment Tax Assessment Total Assessment is a certain percentage of the fair market value that is determined by local assessors to be the total taxable value of land and additions on the property. | Land | Improvement |
|---|---|---|---|---|
| 2025 | $5,922 | $333,811 | $68,696 | $265,115 |
| 2024 | $5,740 | $324,089 | $65,309 | $258,780 |
| 2023 | $5,631 | $314,650 | $61,734 | $252,916 |
| 2022 | $5,476 | $305,486 | $66,613 | $238,873 |
| 2021 | $5,309 | $296,589 | $68,150 | $228,439 |
| 2020 | $4,926 | $287,951 | $69,040 | $218,911 |
| 2019 | $4,696 | $279,565 | $58,162 | $221,403 |
| 2018 | $4,671 | $271,423 | $51,976 | $219,447 |
| 2017 | $4,539 | $263,518 | $53,994 | $209,524 |
| 2016 | $4,259 | $255,843 | $52,059 | $203,784 |
| 2015 | $4,217 | $248,392 | $51,773 | $196,619 |
| 2014 | $4,050 | $241,158 | $50,207 | $190,951 |
| 2013 | -- | $234,134 | $58,914 | $175,220 |
Source: Public Records
Map
Nearby Homes
- 1 Cedar St
- 1460 H St
- 3640 Birch St
- 885 G St
- 3060 Elm St
- 3385 Kirkway St
- 3055 Grove St
- 2909 College St
- 2615 1st St
- 2860 College St
- 2819 College St
- 2130 Cherry St
- 599 Park Springs Ave
- 1602 Broadway St
- 607 Park Springs Ave
- 583 Park Springs Ave
- 591 Park Springs Ave
- 2639 7th St
- 2050 Birch St
- 2365 4th St Unit 205