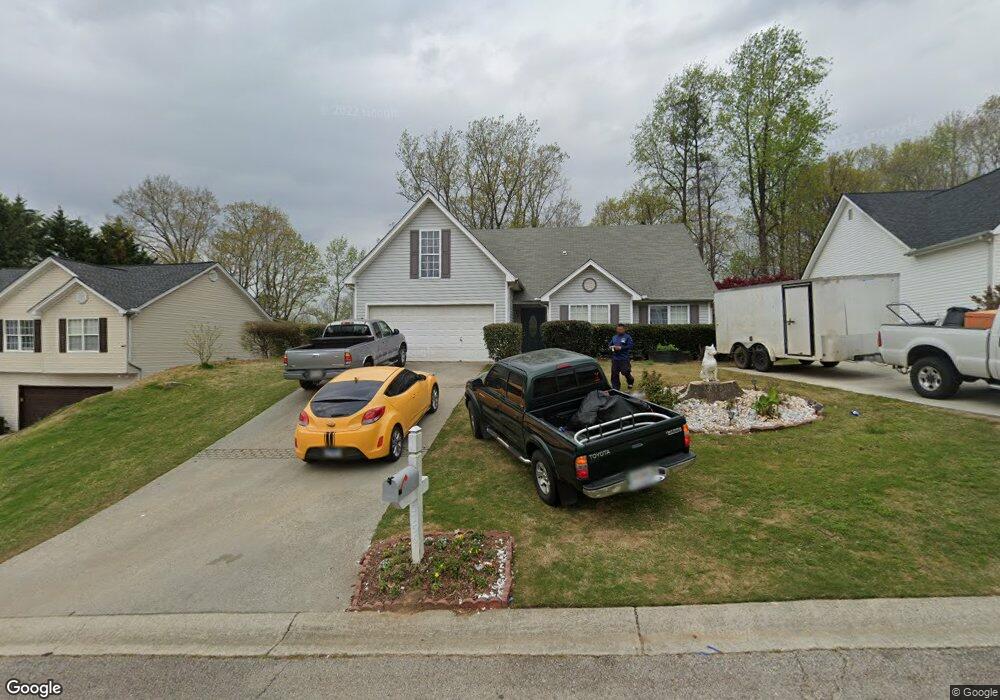
3756 Chesapeake Trace Ln Flowery Branch, GA 30542
Estimated Value: $297,000 - $356,000
3
Beds
2
Baths
1,769
Sq Ft
$187/Sq Ft
Est. Value
About This Home
This home is located at 3756 Chesapeake Trace Ln, Flowery Branch, GA 30542 and is currently estimated at $330,081, approximately $186 per square foot. 3756 Chesapeake Trace Ln is a home located in Hall County with nearby schools including Martin Elementary School, Southwest Middle School, and C.W. Davis Middle School.
Ownership History
Date
Name
Owned For
Owner Type
Purchase Details
Closed on
Feb 20, 2020
Sold by
Gonzalez Jose D
Bought by
Gonzalez Jose D and Cardenas Jose M
Current Estimated Value
Purchase Details
Closed on
Nov 8, 2005
Sold by
Rindahl Jason
Bought by
Gonzalez Jose D and Gonzalez Alfonso
Home Financials for this Owner
Home Financials are based on the most recent Mortgage that was taken out on this home.
Original Mortgage
$135,727
Interest Rate
6.1%
Mortgage Type
FHA
Purchase Details
Closed on
Sep 8, 2000
Sold by
Southern Cross Home Builders Llc
Bought by
Rindahl Jason
Home Financials for this Owner
Home Financials are based on the most recent Mortgage that was taken out on this home.
Original Mortgage
$101,900
Interest Rate
7.97%
Mortgage Type
New Conventional
Create a Home Valuation Report for This Property
The Home Valuation Report is an in-depth analysis detailing your home's value as well as a comparison with similar homes in the area
Home Values in the Area
Average Home Value in this Area
Purchase History
| Date | Buyer | Sale Price | Title Company |
|---|---|---|---|
| Gonzalez Jose D | -- | -- | |
| Gonzalez Jose D | $137,000 | -- | |
| Rindahl Jason | $22,500 | -- |
Source: Public Records
Mortgage History
| Date | Status | Borrower | Loan Amount |
|---|---|---|---|
| Previous Owner | Gonzalez Jose D | $135,727 | |
| Previous Owner | Rindahl Jason | $101,900 |
Source: Public Records
Tax History Compared to Growth
Tax History
| Year | Tax Paid | Tax Assessment Tax Assessment Total Assessment is a certain percentage of the fair market value that is determined by local assessors to be the total taxable value of land and additions on the property. | Land | Improvement |
|---|---|---|---|---|
| 2024 | $2,762 | $108,040 | $18,640 | $89,400 |
| 2023 | $2,252 | $103,040 | $18,640 | $84,400 |
| 2022 | $2,215 | $82,440 | $16,560 | $65,880 |
| 2021 | $1,867 | $67,640 | $9,360 | $58,280 |
| 2020 | $1,808 | $63,600 | $9,360 | $54,240 |
| 2019 | $1,799 | $62,760 | $7,760 | $55,000 |
| 2018 | $1,815 | $61,360 | $7,760 | $53,600 |
| 2017 | $1,354 | $45,520 | $7,760 | $37,760 |
| 2016 | $1,324 | $45,520 | $7,760 | $37,760 |
| 2015 | $975 | $32,564 | $4,640 | $27,924 |
| 2014 | $975 | $32,564 | $4,640 | $27,924 |
Source: Public Records
Map
Nearby Homes
- 4086 Parks Rd
- 4020 Parks Rd
- 3582 Winder Hwy
- 3929 Perry Ln
- 3617 Winder Hwy
- 4684 Martins Crossing Dr W
- 4838 Netherlands Place
- 4021 Laurant Path
- 4013 Laurant Path
- Wakehurst Plan at Falls Creek
- 3935 Alderstone Dr
- Sheridan Plan at Falls Creek
- Avera Plan at Falls Creek
- Atwood Plan at Falls Creek
- Trenton Plan at Falls Creek
- Prescott Plan at Falls Creek
- Ingram Plan at Falls Creek
- Fairfield Plan at Falls Creek
- Denton Plan at Falls Creek
- Edison Plan at Falls Creek
- 3752 Chesapeake Trace Ln
- 3760 Chesapeake Trace Ln
- 3748 Chesapeake Trace Ln
- 3764 Chesapeake Trace Ln
- 3764 Chesapeake Trace Ln Unit 39
- 0 Chesapeake Trace Ln Unit 9026987
- 3744 Chesapeake Trace Ln
- 3751 Chesapeake Trace Ln
- 3755 Chesapeake Trace Ln
- 3747 Chesapeake Trace Ln
- 3759 Chesapeake Trace Ln
- 3740 Chesapeake Trace Ln
- 3763 Chesapeake Trace Ln
- 3743 Chesapeake Trace Ln
- 3767 Chesapeake Trace Ln
- 3767 Chesapeake
- 3736 Chesapeake Trace Ln
- 3739 Chesapeake Trace Ln Unit 52
- 3739 Chesapeake Trace Ln
- 3771 Chesapeake Trace Ln