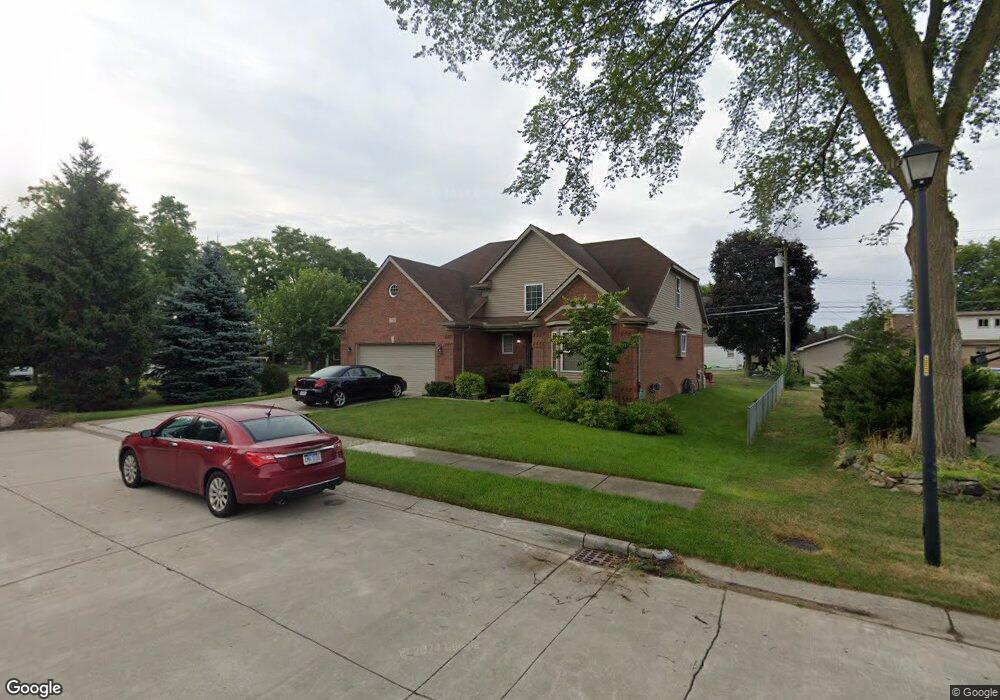
37563 Scone Ct Livonia, MI 48154
Estimated Value: $419,000 - $692,000
4
Beds
3
Baths
2,431
Sq Ft
$210/Sq Ft
Est. Value
About This Home
This home is located at 37563 Scone Ct, Livonia, MI 48154 and is currently estimated at $511,329, approximately $210 per square foot. 37563 Scone Ct is a home located in Wayne County with nearby schools including Randolph Elementary School, Johnson Upper Elementary School, and Frost Middle School.
Ownership History
Date
Name
Owned For
Owner Type
Purchase Details
Closed on
Aug 3, 2014
Sold by
Thiam Mamadou
Bought by
Thiam Cheryl
Current Estimated Value
Home Financials for this Owner
Home Financials are based on the most recent Mortgage that was taken out on this home.
Original Mortgage
$180,000
Outstanding Balance
$137,454
Interest Rate
4.15%
Mortgage Type
New Conventional
Estimated Equity
$373,875
Purchase Details
Closed on
Dec 17, 2009
Sold by
Belaggio Homes Inc
Bought by
Thiam Mamadou
Purchase Details
Closed on
Aug 26, 2009
Sold by
Soave Construction Llc
Bought by
Belaggio Homes Llc
Purchase Details
Closed on
Jun 16, 2009
Sold by
Stock Loan Services Llc
Bought by
Soave Construction Llc
Purchase Details
Closed on
Apr 21, 2009
Sold by
Stock Building Supply Llc
Bought by
Stock Loan Services Llc
Purchase Details
Closed on
Sep 30, 2008
Sold by
Diamante Building Co Inc
Bought by
Stock Building Supply Llc
Create a Home Valuation Report for This Property
The Home Valuation Report is an in-depth analysis detailing your home's value as well as a comparison with similar homes in the area
Home Values in the Area
Average Home Value in this Area
Purchase History
| Date | Buyer | Sale Price | Title Company |
|---|---|---|---|
| Thiam Cheryl | -- | Land Title Agency Llc | |
| Thiam Mamadou | $25,000 | None Available | |
| Belaggio Homes Inc | -- | None Available | |
| Thiam Mamadou | -- | Ltic | |
| Belaggio Homes Llc | -- | First Centennial Title Ins | |
| Soave Construction Llc | $15,000 | Seaver Title | |
| Stock Loan Services Llc | -- | None Available | |
| Stock Building Supply Llc | -- | None Available |
Source: Public Records
Mortgage History
| Date | Status | Borrower | Loan Amount |
|---|---|---|---|
| Open | Thiam Cheryl | $180,000 |
Source: Public Records
Tax History Compared to Growth
Tax History
| Year | Tax Paid | Tax Assessment Tax Assessment Total Assessment is a certain percentage of the fair market value that is determined by local assessors to be the total taxable value of land and additions on the property. | Land | Improvement |
|---|---|---|---|---|
| 2025 | $3,101 | $222,900 | $0 | $0 |
| 2024 | $3,101 | $213,600 | $0 | $0 |
| 2023 | $2,958 | $197,200 | $0 | $0 |
| 2022 | $5,298 | $183,300 | $0 | $0 |
| 2021 | $5,151 | $178,000 | $0 | $0 |
| 2019 | $4,963 | $168,100 | $0 | $0 |
| 2018 | $2,501 | $160,600 | $0 | $0 |
| 2017 | $4,659 | $167,300 | $0 | $0 |
| 2016 | $4,766 | $167,300 | $0 | $0 |
| 2015 | $11,267 | $157,220 | $0 | $0 |
| 2012 | -- | $116,220 | $17,100 | $99,120 |
Source: Public Records
Map
Nearby Homes
- 37642 Scone Ct
- 37633 Scone Ct
- 37656 Schoolcraft Rd
- 37800 Schoolcraft Rd
- 14411 Nola St
- 38502 Summers St
- 14557 Richfield St
- 14367 Houghton St
- 14677 Newburgh Rd
- 9410 Annalia Dr
- 14285 Adams St
- 36024 Schoolcraft Rd
- 39050 Lyndon St
- 15111 Houghton St
- 14469 Bassett St
- 39237 Grennada St
- 37801 Plymouth Rd
- 15307 Williams St
- 39175 Parkhurst St
- 35638 Grennada St
- 37564 Scone Ct
- 37582 Schoolcraft Rd
- 37568 Schoolcraft Rd
- 37587 Scone Ct
- 37554 Schoolcraft Rd
- 37526 Schoolcraft Rd
- 37576 Scone Ct
- 37600 Schoolcraft Rd Unit Bldg-Unit
- 37600 Schoolcraft Rd
- 13979 Richfield St
- 37588 Scone Ct
- 37618 Schoolcraft Rd
- 37604 Scone Ct
- 14003 Richfield St
- 14025 Richfield St
- 37567 Summers St
- 37619 Scone Ct
- 37620 Scone Ct
- 14040 Stonehouse Ave
- 37593 Summers St