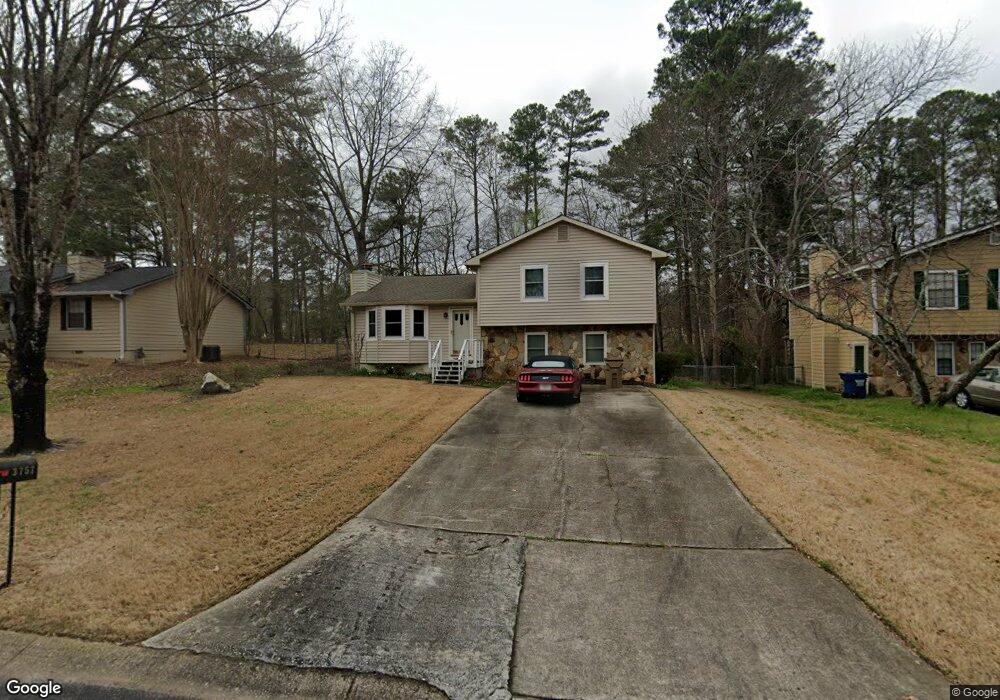
3757 Ferncliff Rd Unit 5 Snellville, GA 30039
Estimated Value: $252,000 - $310,794
3
Beds
2
Baths
1,136
Sq Ft
$257/Sq Ft
Est. Value
About This Home
This home is located at 3757 Ferncliff Rd Unit 5, Snellville, GA 30039 and is currently estimated at $291,949, approximately $256 per square foot. 3757 Ferncliff Rd Unit 5 is a home located in Gwinnett County with nearby schools including Shiloh Elementary School, Shiloh Middle School, and Shiloh High School.
Ownership History
Date
Name
Owned For
Owner Type
Purchase Details
Closed on
Apr 30, 2004
Sold by
Dance James W and Dance Elizabeth E
Bought by
Mcbride Doreen M
Current Estimated Value
Home Financials for this Owner
Home Financials are based on the most recent Mortgage that was taken out on this home.
Original Mortgage
$94,000
Outstanding Balance
$43,638
Interest Rate
5.36%
Mortgage Type
New Conventional
Estimated Equity
$248,311
Purchase Details
Closed on
Apr 24, 2000
Sold by
Smith Joe M and Smith Millicent A
Bought by
Dwyer Elizabeth E
Home Financials for this Owner
Home Financials are based on the most recent Mortgage that was taken out on this home.
Original Mortgage
$107,017
Interest Rate
8.23%
Mortgage Type
FHA
Purchase Details
Closed on
Aug 28, 1998
Sold by
Weinraub Anita Z Executrix
Bought by
Smith Joe Michael and Smith Millic
Home Financials for this Owner
Home Financials are based on the most recent Mortgage that was taken out on this home.
Original Mortgage
$88,317
Interest Rate
6.95%
Create a Home Valuation Report for This Property
The Home Valuation Report is an in-depth analysis detailing your home's value as well as a comparison with similar homes in the area
Home Values in the Area
Average Home Value in this Area
Purchase History
| Date | Buyer | Sale Price | Title Company |
|---|---|---|---|
| Mcbride Doreen M | $119,000 | -- | |
| Dwyer Elizabeth E | $107,900 | -- | |
| Smith Joe Michael | $40,300 | -- |
Source: Public Records
Mortgage History
| Date | Status | Borrower | Loan Amount |
|---|---|---|---|
| Open | Mcbride Doreen M | $94,000 | |
| Previous Owner | Dwyer Elizabeth E | $107,017 | |
| Previous Owner | Smith Joe Michael | $88,317 |
Source: Public Records
Tax History Compared to Growth
Tax History
| Year | Tax Paid | Tax Assessment Tax Assessment Total Assessment is a certain percentage of the fair market value that is determined by local assessors to be the total taxable value of land and additions on the property. | Land | Improvement |
|---|---|---|---|---|
| 2024 | $2,855 | $95,800 | $23,720 | $72,080 |
| 2023 | $2,855 | $101,000 | $22,400 | $78,600 |
| 2022 | $2,675 | $89,080 | $17,200 | $71,880 |
| 2021 | $2,216 | $65,720 | $12,400 | $53,320 |
| 2020 | $2,229 | $65,720 | $12,400 | $53,320 |
| 2019 | $1,951 | $55,600 | $10,000 | $45,600 |
| 2018 | $1,792 | $48,600 | $10,000 | $38,600 |
| 2016 | $1,441 | $37,920 | $8,000 | $29,920 |
| 2015 | $1,114 | $28,400 | $4,000 | $24,400 |
| 2014 | $1,118 | $28,400 | $4,000 | $24,400 |
Source: Public Records
Map
Nearby Homes
- 3738 Burnt Leaf Ln
- 2654 Laurel View Dr
- 2675 Wildflower Ln
- 2633 Brannan Rd
- 3932 Ferncliff Rd
- 3695 Winterberry Ln
- 3963 Ferncliff Rd
- 3681 Basswood Rd
- 3893 Tanglewood Rd
- 3948 Valley Brook Rd
- 2895 Wildflower Ln
- 3919 Valley Brook Rd
- 2315 Oakland Spring Dr
- 3637 Chinaberry Ln
- 2650 Wendell Creek Ln
- 3960 Rocmar Dr
- 3774 Eli Dr
- 3749 Ferncliff Rd Unit 5
- 3765 Ferncliff Rd Unit 5
- 0 Ferncliff Rd SW Unit 8672160
- 0 Ferncliff Rd SW Unit 8642332
- 0 Ferncliff Rd SW Unit 8309252
- 0 Ferncliff Rd SW Unit 8215373
- 0 Ferncliff Rd SW Unit 8076498
- 0 Ferncliff Rd SW Unit 8628451
- 0 Ferncliff Rd SW Unit 8527390
- 0 Ferncliff Rd SW Unit 7621756
- 0 Ferncliff Rd SW Unit 7367481
- 0 Ferncliff Rd SW Unit 9071101
- 0 Ferncliff Rd SW Unit 8744589
- 0 Ferncliff Rd SW Unit 7283993
- 0 Ferncliff Rd SW Unit 7297371
- 0 Ferncliff Rd SW Unit 7366869
- 0 Ferncliff Rd SW
- 3838 Burnt Leaf Ln
- 3741 Ferncliff Rd
- 3848 Burnt Leaf Ln Unit 5