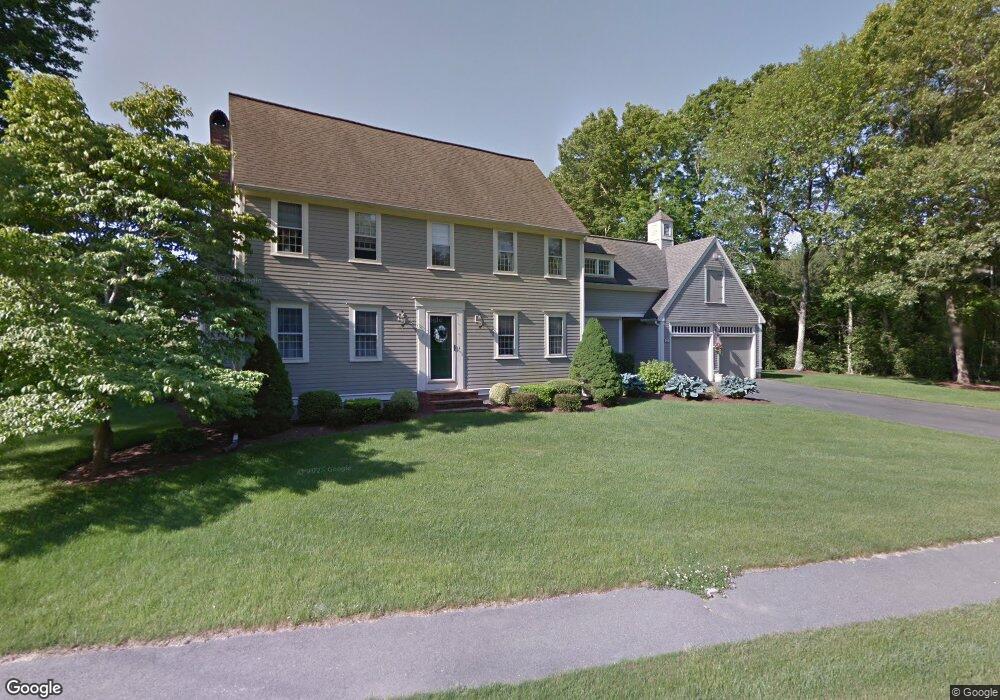
376 Ash St West Bridgewater, MA 02379
Estimated Value: $616,000 - $845,000
3
Beds
3
Baths
3,057
Sq Ft
$245/Sq Ft
Est. Value
About This Home
This home is located at 376 Ash St, West Bridgewater, MA 02379 and is currently estimated at $747,600, approximately $244 per square foot. 376 Ash St is a home located in Plymouth County with nearby schools including Spring Street Elementary School, Howard Elementary School, and Rose L. MacDonald Elementary School.
Ownership History
Date
Name
Owned For
Owner Type
Purchase Details
Closed on
May 12, 2025
Sold by
Hazlett Ft and Hazlett
Bought by
Hazlett Robert and Hazlett Deborah
Current Estimated Value
Home Financials for this Owner
Home Financials are based on the most recent Mortgage that was taken out on this home.
Original Mortgage
$190,000
Outstanding Balance
$188,983
Interest Rate
6.64%
Mortgage Type
New Conventional
Estimated Equity
$558,617
Purchase Details
Closed on
Nov 1, 2022
Sold by
Hazlett Robert A and Hazlett Deborah J
Bought by
Hazlett Ft and Hazlett
Purchase Details
Closed on
Aug 4, 1999
Sold by
American Manufacture and Civitarese
Bought by
Hazlett Robert and Hazlett Deborah
Create a Home Valuation Report for This Property
The Home Valuation Report is an in-depth analysis detailing your home's value as well as a comparison with similar homes in the area
Home Values in the Area
Average Home Value in this Area
Purchase History
| Date | Buyer | Sale Price | Title Company |
|---|---|---|---|
| Hazlett Robert | -- | None Available | |
| Hazlett Robert | -- | None Available | |
| Hazlett Ft | -- | None Available | |
| Hazlett Ft | -- | None Available | |
| Hazlett Robert | $8,000 | -- | |
| Hazlett Robert | $8,000 | -- |
Source: Public Records
Mortgage History
| Date | Status | Borrower | Loan Amount |
|---|---|---|---|
| Open | Hazlett Robert | $190,000 | |
| Closed | Hazlett Robert | $190,000 | |
| Previous Owner | Hazlett Robert | $40,000 | |
| Previous Owner | Hazlett Robert | $118,000 |
Source: Public Records
Tax History Compared to Growth
Tax History
| Year | Tax Paid | Tax Assessment Tax Assessment Total Assessment is a certain percentage of the fair market value that is determined by local assessors to be the total taxable value of land and additions on the property. | Land | Improvement |
|---|---|---|---|---|
| 2025 | $9,226 | $674,900 | $220,500 | $454,400 |
| 2024 | $9,069 | $640,000 | $199,900 | $440,100 |
| 2023 | $8,254 | $537,000 | $173,100 | $363,900 |
| 2022 | $8,000 | $493,200 | $162,800 | $330,400 |
| 2021 | $7,762 | $464,500 | $162,800 | $301,700 |
| 2020 | $12,599 | $478,800 | $162,800 | $316,000 |
| 2019 | $7,726 | $467,400 | $162,800 | $304,600 |
| 2018 | $9,012 | $448,600 | $154,500 | $294,100 |
| 2017 | $7,578 | $427,400 | $140,100 | $287,300 |
| 2016 | $7,515 | $417,500 | $130,200 | $287,300 |
| 2015 | $7,259 | $407,600 | $130,200 | $277,400 |
| 2014 | $6,721 | $407,600 | $130,200 | $277,400 |
Source: Public Records
Map
Nearby Homes
- 30 Keenan St
- 603 East St
- 192 S Main St
- 4 Mullen Way
- 60 Miranda Way
- 116 Center St
- 18 Aldrich Rd
- 10 Duck Farm Ln
- 248 Center St Unit 7
- 92 Bryant St
- 34 Captain Carlson Way
- 6 Andrea Way
- 180 Main St Unit A15
- 180 Main St Unit A5
- 580 Broad St Unit 1
- 580 Broad St Unit 2
- 245-r Laurel St
- 12 Perkins St
- 128 Broad St
- 10 College Rd