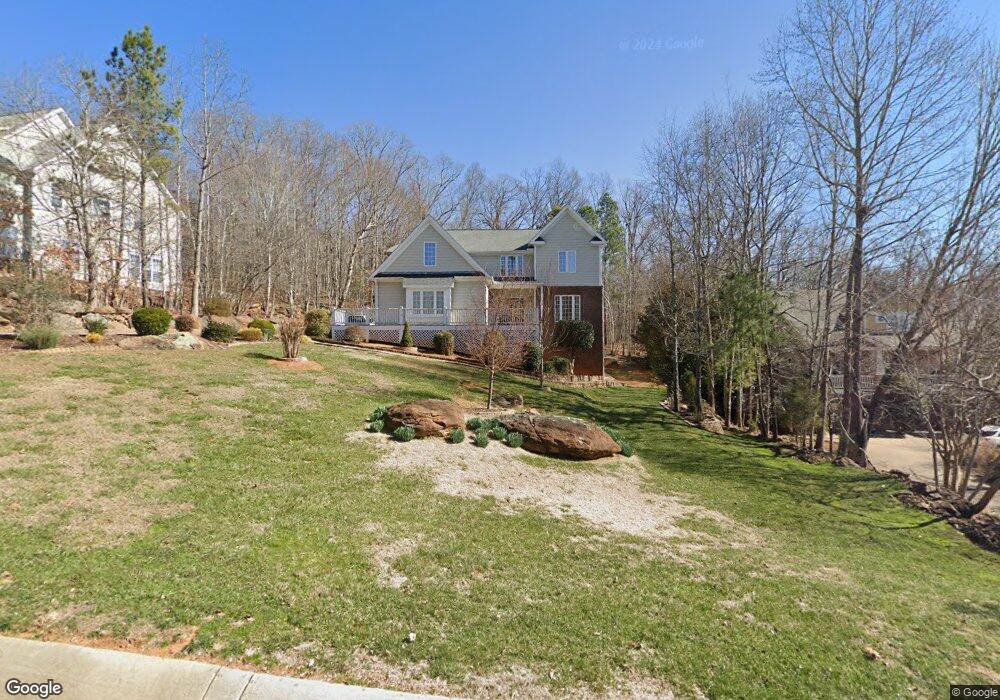
376 Bellemont Rd Pittsboro, NC 27312
Estimated Value: $570,000 - $677,000
4
Beds
3
Baths
2,956
Sq Ft
$218/Sq Ft
Est. Value
About This Home
This home is located at 376 Bellemont Rd, Pittsboro, NC 27312 and is currently estimated at $643,364, approximately $217 per square foot. 376 Bellemont Rd is a home located in Chatham County with nearby schools including Pittsboro Elementary School, George Moses Horton Middle School, and Northwood High.
Ownership History
Date
Name
Owned For
Owner Type
Purchase Details
Closed on
Sep 24, 2012
Sold by
Federal National Mortgage Association
Bought by
Doerge Christopher Henry
Current Estimated Value
Home Financials for this Owner
Home Financials are based on the most recent Mortgage that was taken out on this home.
Original Mortgage
$263,000
Outstanding Balance
$180,039
Interest Rate
3.42%
Mortgage Type
New Conventional
Estimated Equity
$463,325
Purchase Details
Closed on
Mar 26, 2012
Sold by
Oleary Kathryn and Escott Janice
Bought by
Federal National Mortgage Association
Purchase Details
Closed on
Apr 24, 2007
Sold by
Michael Morrow Inc
Bought by
Oleary Kathryn and Bagai Rishi V
Home Financials for this Owner
Home Financials are based on the most recent Mortgage that was taken out on this home.
Original Mortgage
$48,690
Interest Rate
6.11%
Mortgage Type
Credit Line Revolving
Create a Home Valuation Report for This Property
The Home Valuation Report is an in-depth analysis detailing your home's value as well as a comparison with similar homes in the area
Home Values in the Area
Average Home Value in this Area
Purchase History
| Date | Buyer | Sale Price | Title Company |
|---|---|---|---|
| Doerge Christopher Henry | -- | None Available | |
| Federal National Mortgage Association | $409,693 | None Available | |
| Oleary Kathryn | $487,000 | None Available |
Source: Public Records
Mortgage History
| Date | Status | Borrower | Loan Amount |
|---|---|---|---|
| Open | Doerge Christopher Henry | $263,000 | |
| Previous Owner | Oleary Kathryn | $48,690 | |
| Previous Owner | Oleary Kathryn | $389,520 |
Source: Public Records
Tax History Compared to Growth
Tax History
| Year | Tax Paid | Tax Assessment Tax Assessment Total Assessment is a certain percentage of the fair market value that is determined by local assessors to be the total taxable value of land and additions on the property. | Land | Improvement |
|---|---|---|---|---|
| 2025 | $6,738 | $624,336 | $109,958 | $514,378 |
| 2024 | $6,738 | $417,251 | $91,631 | $325,620 |
| 2023 | $5,096 | $417,251 | $91,631 | $325,620 |
| 2022 | $4,821 | $417,251 | $91,631 | $325,620 |
| 2021 | $4,783 | $417,251 | $91,631 | $325,620 |
| 2020 | $5,035 | $438,662 | $68,723 | $369,939 |
| 2019 | $5,025 | $438,662 | $68,723 | $369,939 |
| 2018 | $4,821 | $438,662 | $68,723 | $369,939 |
| 2017 | $4,821 | $438,662 | $68,723 | $369,939 |
| 2016 | $5,090 | $461,570 | $91,631 | $369,939 |
| 2015 | $5,035 | $461,570 | $91,631 | $369,939 |
| 2014 | $5,035 | $461,570 | $91,631 | $369,939 |
| 2013 | -- | $461,570 | $91,631 | $369,939 |
Source: Public Records
Map
Nearby Homes
- 1157 Hillsboro St
- 54 Pattishall Rd
- 186 Millennium Dr
- 142 Autumn Gate St
- 116 Kensington Dr
- 24 Cynthia Ln
- 17 Plenty Ct
- 710 Vine Pkwy
- Tbd Versailles Ln
- 53 Circle City Way
- 425 Credle St
- 41 Cottage Way
- 11 Allgood St
- 298 E Salisbury St
- 726 Thompson St
- 25 Juleann Ln
- 122 Norwell Ln
- 291 Wendover Pkwy
- 230 Oakwood Dr
- 155 Norwell Ln
- 356 Bellemont Rd
- 400 Bellemont Rd
- 340 Bellemont Rd
- 21 Bellemont Ridge Rd
- 403 Bellemont Rd
- 403 Bellemont Rd
- 403 Bellemont Rd Unit 189
- 9 Bellemont Ridge Rd
- 9 Bellemont Ridge Rd Unit 197
- 359 Bellemont Rd
- 334 Bellemont Rd
- 371 Bellemont Rd
- 371 Bellemont Rd
- 371 Bellemont Rd Unit 188
- 343 Bellemont Rd
- 59 Bellemont Ridge Rd
- 59 Bellemont Ridge Rd Unit 190
- 403 Bellemont Ridge Rd
- 371 Bellemont Ridge Rd
- 70 Bellemont Ridge Rd