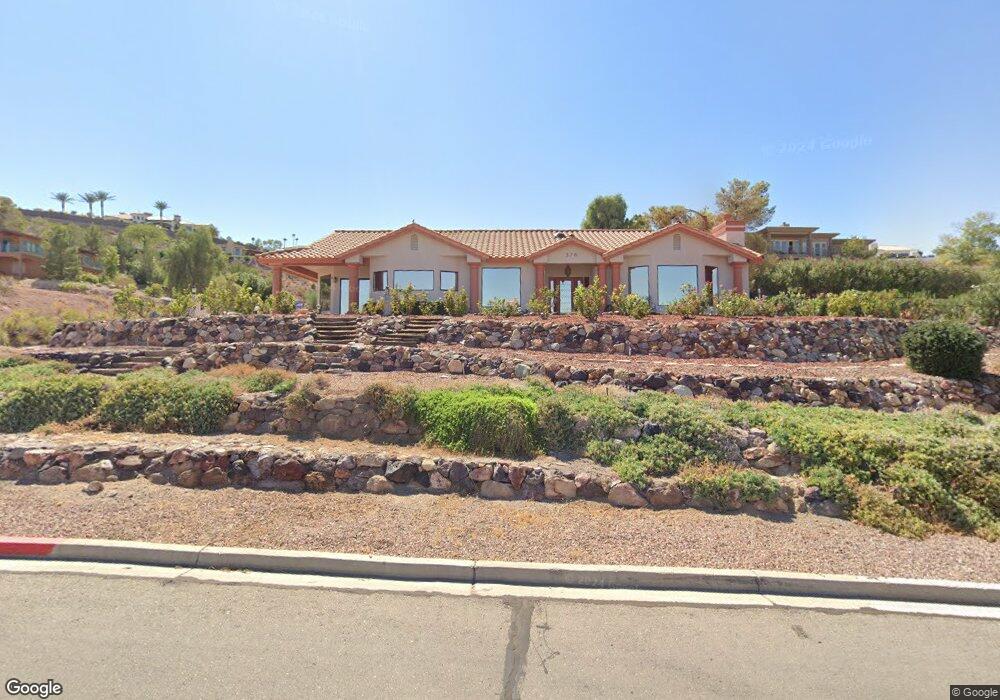
376 Claremont St Boulder City, NV 89005
Estimated Value: $1,042,801 - $1,504,000
3
Beds
3
Baths
2,825
Sq Ft
$452/Sq Ft
Est. Value
About This Home
This home is located at 376 Claremont St, Boulder City, NV 89005 and is currently estimated at $1,275,950, approximately $451 per square foot. 376 Claremont St is a home located in Clark County with nearby schools including Andrew Mitchell Elementary School, Martha P. King Elementary School, and Elton M. & Madelaine E. Garrett Junior High School.
Ownership History
Date
Name
Owned For
Owner Type
Purchase Details
Closed on
Nov 8, 2024
Sold by
Kafka Kenen Trust and Kenen Oliver Ken
Bought by
Angel Foong Lian Chong Trust and Chong
Current Estimated Value
Purchase Details
Closed on
May 6, 2009
Sold by
Kafka Phyllis J and Kenen Oliver K
Bought by
Kenen Oliver K and Kafka Phyllis J
Home Financials for this Owner
Home Financials are based on the most recent Mortgage that was taken out on this home.
Original Mortgage
$245,000
Interest Rate
4.8%
Mortgage Type
New Conventional
Purchase Details
Closed on
Sep 28, 2004
Sold by
Kenen Oliver K and Kafka Phyllis J
Bought by
Kenen Oliver K and Kafka Phyllis J
Purchase Details
Closed on
Oct 22, 1999
Sold by
Burkholder Lowell E and Burkholder Mary J
Bought by
Kenen Oliver K and Kafka Phyllis J
Home Financials for this Owner
Home Financials are based on the most recent Mortgage that was taken out on this home.
Original Mortgage
$480,000
Interest Rate
7.82%
Mortgage Type
Seller Take Back
Create a Home Valuation Report for This Property
The Home Valuation Report is an in-depth analysis detailing your home's value as well as a comparison with similar homes in the area
Home Values in the Area
Average Home Value in this Area
Purchase History
| Date | Buyer | Sale Price | Title Company |
|---|---|---|---|
| Angel Foong Lian Chong Trust | -- | Security 1St Title | |
| Kenen Oliver K | -- | Old Republic Title Company O | |
| Kafka Phillis J | -- | Old Republic Title Company O | |
| Kenen Oliver K | -- | -- | |
| Kenen Oliver K | $580,000 | United Title |
Source: Public Records
Mortgage History
| Date | Status | Borrower | Loan Amount |
|---|---|---|---|
| Previous Owner | Kafka Phillis J | $245,000 | |
| Previous Owner | Kenen Oliver K | $480,000 |
Source: Public Records
Tax History Compared to Growth
Tax History
| Year | Tax Paid | Tax Assessment Tax Assessment Total Assessment is a certain percentage of the fair market value that is determined by local assessors to be the total taxable value of land and additions on the property. | Land | Improvement |
|---|---|---|---|---|
| 2025 | $4,448 | $233,595 | $94,938 | $138,657 |
| 2024 | $4,247 | $233,595 | $94,938 | $138,657 |
| 2023 | $4,247 | $225,636 | $94,938 | $130,698 |
| 2022 | $4,123 | $216,014 | $94,938 | $121,076 |
| 2021 | $4,003 | $211,054 | $94,938 | $116,116 |
| 2020 | $3,885 | $196,113 | $79,748 | $116,365 |
| 2019 | $3,772 | $193,863 | $78,663 | $115,200 |
| 2018 | $3,662 | $191,121 | $78,663 | $112,458 |
| 2017 | $4,906 | $187,882 | $73,238 | $114,644 |
| 2016 | $3,465 | $185,897 | $70,525 | $115,372 |
| 2015 | $3,537 | $185,171 | $70,525 | $114,646 |
| 2014 | $3,436 | $162,508 | $54,250 | $108,258 |
Source: Public Records
Map
Nearby Homes
- 374 Claremont St
- 380 Claremont St
- 701 Park Place
- 1315 Alpine Dr
- 698 Magic Cove Ct
- 1318 Alpine Dr
- 650 Arizona St
- 1320 Alpine Dr
- 105 Lighthouse Dr Unit 723
- 144 Lake Mountain Dr
- 224 Morgyn Ln Unit 6
- 148 Tumbleweed Dr
- 1409 Denver St
- 655 Florence Dr
- 394 Arizona St
- 219 Big Horn Dr Unit 3
- Windsor Plan at Heritage Peak
- Somerset Plan at Heritage Peak
- 620 Avenue H
- 624 Avenue H
- 377 Laurel Dr
- 375 Laurel Dr
- 378 Claremont St
- 377 Claremont St
- 379 Claremont St
- 384 Laurel Dr
- 375 Claremont St
- 370 Claremont St
- 376 Laurel Dr
- 378 Laurel Dr
- 381 Claremont St
- 1243 Tamarisk Ln
- 371 Claremont St
- 393 Avenue I Unit I
- 382 Claremont St
- 382 Laurel Dr Unit 2
- 1247 Tamarisk Ln
- 379 Avenue I
- 383 Claremont St
- 375 Avenue I Unit I