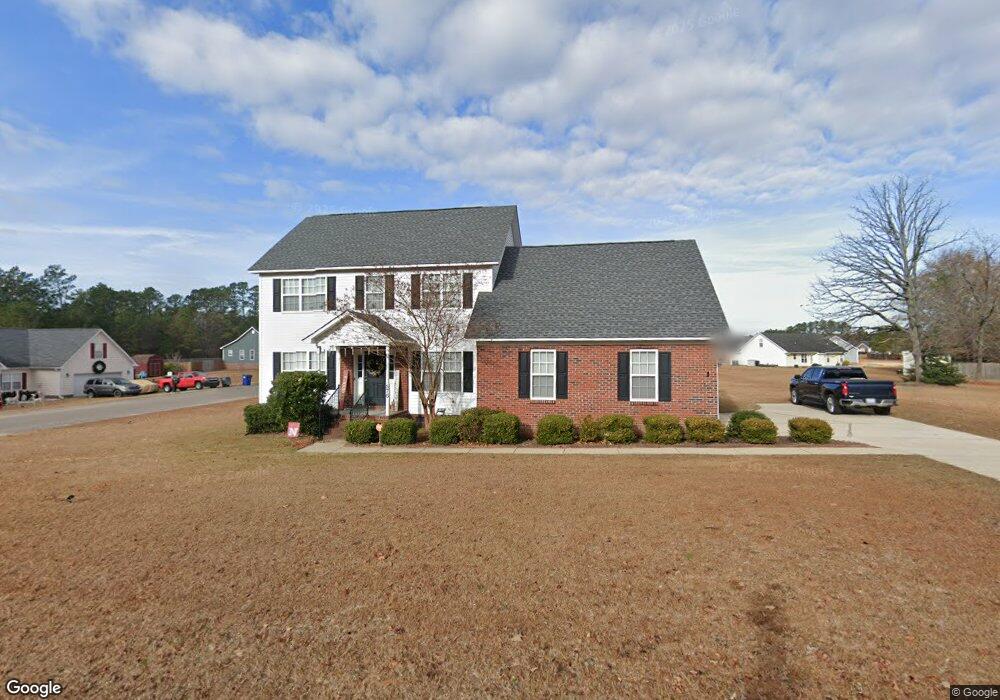
376 Gibson Dr Raeford, NC 28376
Estimated Value: $270,000 - $302,000
3
Beds
3
Baths
1,956
Sq Ft
$146/Sq Ft
Est. Value
About This Home
This home is located at 376 Gibson Dr, Raeford, NC 28376 and is currently estimated at $285,209, approximately $145 per square foot. 376 Gibson Dr is a home located in Hoke County with nearby schools including Scurlock Elementary School, Sandy Grove Middle School, and Hoke County High.
Ownership History
Date
Name
Owned For
Owner Type
Purchase Details
Closed on
Jan 16, 2007
Sold by
Trimark Development Inc
Bought by
Walton Kyle Matthew
Current Estimated Value
Home Financials for this Owner
Home Financials are based on the most recent Mortgage that was taken out on this home.
Original Mortgage
$174,676
Outstanding Balance
$78,328
Interest Rate
6.08%
Mortgage Type
VA
Estimated Equity
$206,881
Create a Home Valuation Report for This Property
The Home Valuation Report is an in-depth analysis detailing your home's value as well as a comparison with similar homes in the area
Home Values in the Area
Average Home Value in this Area
Purchase History
| Date | Buyer | Sale Price | Title Company |
|---|---|---|---|
| Walton Kyle Matthew | $171,000 | None Available |
Source: Public Records
Mortgage History
| Date | Status | Borrower | Loan Amount |
|---|---|---|---|
| Open | Walton Kyle Matthew | $174,676 |
Source: Public Records
Tax History Compared to Growth
Tax History
| Year | Tax Paid | Tax Assessment Tax Assessment Total Assessment is a certain percentage of the fair market value that is determined by local assessors to be the total taxable value of land and additions on the property. | Land | Improvement |
|---|---|---|---|---|
| 2025 | $1,824 | $209,170 | $23,000 | $186,170 |
| 2024 | $1,824 | $209,170 | $23,000 | $186,170 |
| 2023 | $1,824 | $209,170 | $23,000 | $186,170 |
| 2022 | $1,790 | $209,170 | $23,000 | $186,170 |
| 2021 | $1,663 | $188,430 | $23,000 | $165,430 |
| 2020 | $1,692 | $188,430 | $23,000 | $165,430 |
| 2019 | $1,692 | $188,430 | $23,000 | $165,430 |
| 2018 | $1,692 | $188,430 | $23,000 | $165,430 |
| 2017 | $1,692 | $188,430 | $23,000 | $165,430 |
| 2016 | $1,661 | $188,430 | $23,000 | $165,430 |
| 2015 | $1,661 | $188,430 | $23,000 | $165,430 |
| 2014 | $1,636 | $188,430 | $23,000 | $165,430 |
| 2013 | -- | $171,360 | $25,000 | $146,360 |
Source: Public Records
Map
Nearby Homes