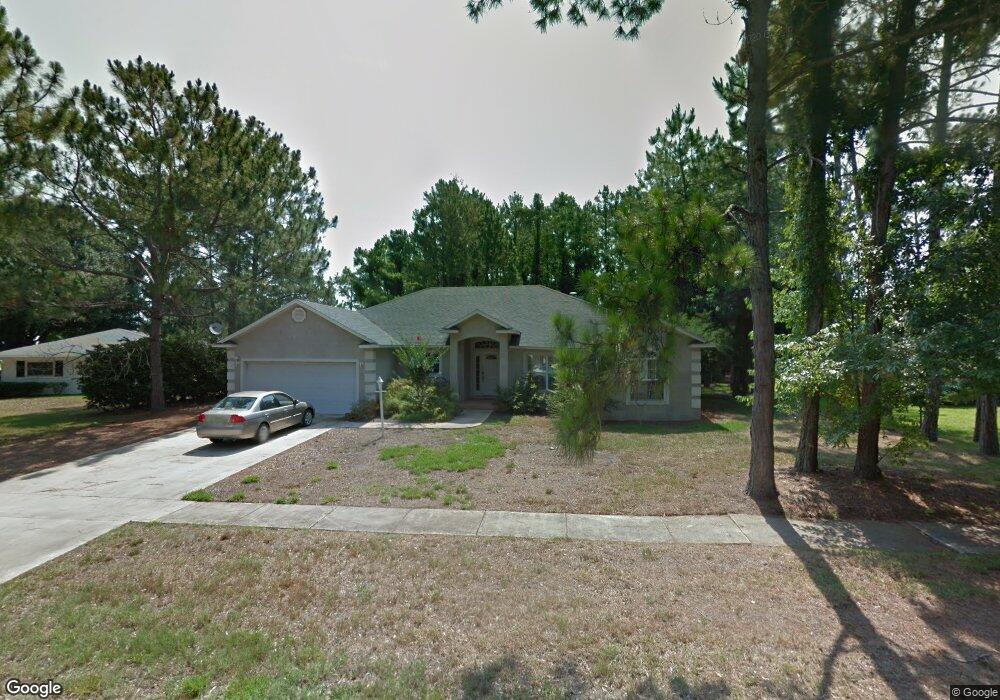
376 Graciela Cir Saint Augustine, FL 32086
Estimated Value: $399,000 - $461,000
3
Beds
2
Baths
1,986
Sq Ft
$219/Sq Ft
Est. Value
About This Home
This home is located at 376 Graciela Cir, Saint Augustine, FL 32086 and is currently estimated at $435,573, approximately $219 per square foot. 376 Graciela Cir is a home located in St. Johns County with nearby schools including W. Douglas Hartley Elementary School, Gamble Rogers Middle School, and Pedro Menendez High School.
Ownership History
Date
Name
Owned For
Owner Type
Purchase Details
Closed on
Mar 25, 2024
Sold by
Thomas P Mc Nerney P and Thomas Paula K
Bought by
Oleary Daniel Kevin
Current Estimated Value
Home Financials for this Owner
Home Financials are based on the most recent Mortgage that was taken out on this home.
Original Mortgage
$203,600
Outstanding Balance
$199,126
Interest Rate
6.77%
Mortgage Type
New Conventional
Estimated Equity
$236,447
Purchase Details
Closed on
Feb 18, 2021
Sold by
Oleary Daniel Kevin and Estate Of Thomas P Mcnerney
Bought by
Oleary Daniel Kevin
Purchase Details
Closed on
May 9, 2006
Sold by
Mcnerney Thomas P and Mc Nerney Paula K
Bought by
Mcnerney Thomas P and Mc Nerney Paula K
Purchase Details
Closed on
Apr 14, 2000
Sold by
Desanto John
Bought by
Mcnerney Thomas P and Mcnerney Paula K
Create a Home Valuation Report for This Property
The Home Valuation Report is an in-depth analysis detailing your home's value as well as a comparison with similar homes in the area
Home Values in the Area
Average Home Value in this Area
Purchase History
| Date | Buyer | Sale Price | Title Company |
|---|---|---|---|
| Oleary Daniel Kevin | $100 | Coast One Title | |
| Oleary Daniel Kevin | $100 | Coast One Title | |
| Oleary Daniel Kevin | -- | Attorney | |
| Mcnerney Thomas P | -- | Attorney | |
| Mcnerney Thomas P | $33,000 | Land Title America |
Source: Public Records
Mortgage History
| Date | Status | Borrower | Loan Amount |
|---|---|---|---|
| Open | Oleary Daniel Kevin | $203,600 | |
| Closed | Oleary Daniel Kevin | $203,600 |
Source: Public Records
Tax History
| Year | Tax Paid | Tax Assessment Tax Assessment Total Assessment is a certain percentage of the fair market value that is determined by local assessors to be the total taxable value of land and additions on the property. | Land | Improvement |
|---|---|---|---|---|
| 2025 | $5,151 | $457,852 | $112,500 | $345,352 |
| 2024 | $5,151 | $454,536 | $112,500 | $342,036 |
| 2023 | $5,151 | $439,423 | $112,500 | $326,923 |
| 2022 | $4,853 | $422,459 | $72,800 | $349,659 |
| 2021 | $3,992 | $285,904 | $0 | $0 |
| 2020 | $4,073 | $288,665 | $0 | $0 |
| 2019 | $2,404 | $195,292 | $0 | $0 |
| 2018 | $2,372 | $191,651 | $0 | $0 |
| 2017 | $2,361 | $187,709 | $0 | $0 |
| 2016 | $2,359 | $189,363 | $0 | $0 |
Source: Public Records
Map
Nearby Homes
- 394 Cassandra Ln
- 398 Graciela Cir
- 124 Santorini Ct
- 216 Santorini Ct
- 301 Graciela Cir
- 272 Grand Ravine Dr
- 38 Litke Ln
- 259 Grand Ravine Dr
- 264 Grand Ravine Dr
- 254 Grand Ravine Dr
- 251 Grand Ravine Dr
- 180 Canyon Trail
- 268 Grand Ravine Dr
- 107 Canyon Trail
- 241 Grand Ravine Dr
- 237 Grand Ravine Dr
- 255 Grand Ravine Dr
- 116 Morningview Place
- 4900-B US 1 S
- 130 Grand Ravine Dr
- 372 Graciela Cir
- 390 Cassandra Ln
- 375 Graciela Cir
- 379 Graciela Cir
- 371 Graciela Cir
- 368 Graciela Cir
- 383 Graciela Cir
- 391 Cassandra Ln Unit 2
- 387 Graciela Cir
- 363 Graciela Cir
- 395 Cassandra Ln
- 364 Graciela Cir
- 398 Cassandra Ln
- 391 Graciela Cir Unit 2
- 346 Rosa Ct
- 396 Graciela Cir
- 359 Graciela Cir
- 346 Graciela Cir
- 399 Cassandra Ln
Your Personal Tour Guide
Ask me questions while you tour the home.