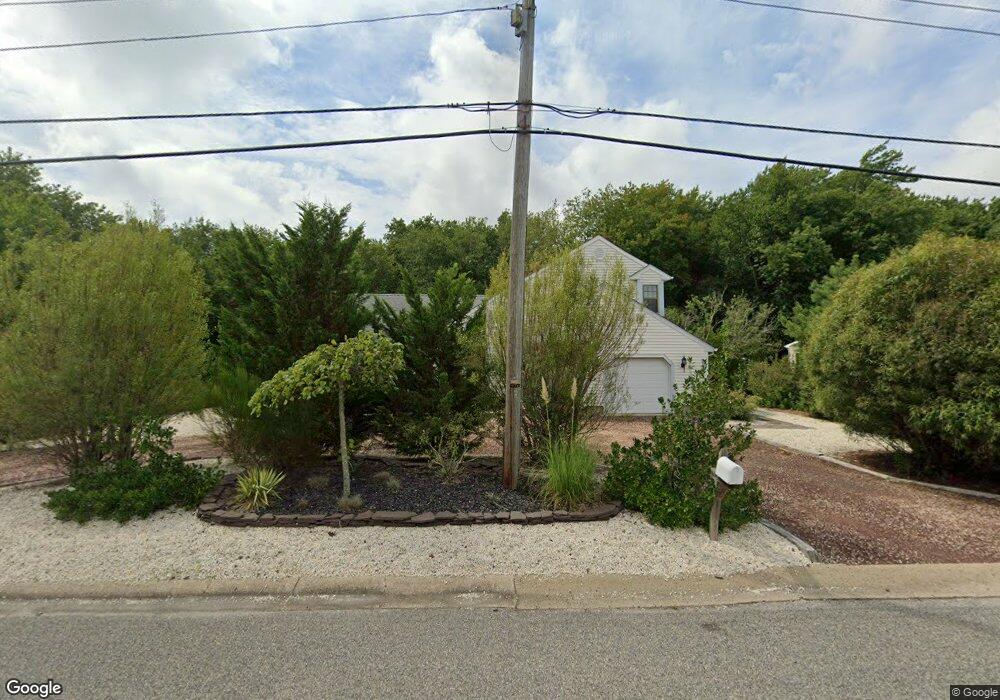
376 Jennings Rd Manahawkin, NJ 08050
Stafford NeighborhoodEstimated Value: $580,000 - $615,221
3
Beds
3
Baths
1,672
Sq Ft
$355/Sq Ft
Est. Value
About This Home
This home is located at 376 Jennings Rd, Manahawkin, NJ 08050 and is currently estimated at $593,805, approximately $355 per square foot. 376 Jennings Rd is a home located in Ocean County with nearby schools including Oxycocus Elementary School, Ocean Acres Elementary School, and McKinley Avenue Elementary School.
Ownership History
Date
Name
Owned For
Owner Type
Purchase Details
Closed on
Nov 13, 2009
Sold by
Hermann Robert and Hermann Lorraine
Bought by
Griffin Russell
Current Estimated Value
Home Financials for this Owner
Home Financials are based on the most recent Mortgage that was taken out on this home.
Original Mortgage
$272,473
Outstanding Balance
$176,636
Interest Rate
4.86%
Mortgage Type
FHA
Estimated Equity
$417,169
Purchase Details
Closed on
Oct 19, 2007
Sold by
Seip Joseph A and Seip Delores J
Bought by
Hermann Robert and Hermann Lorraine
Create a Home Valuation Report for This Property
The Home Valuation Report is an in-depth analysis detailing your home's value as well as a comparison with similar homes in the area
Home Values in the Area
Average Home Value in this Area
Purchase History
| Date | Buyer | Sale Price | Title Company |
|---|---|---|---|
| Griffin Russell | $277,500 | First American Title Ins Co | |
| Hermann Robert | $300,000 | None Available |
Source: Public Records
Mortgage History
| Date | Status | Borrower | Loan Amount |
|---|---|---|---|
| Open | Griffin Russell | $272,473 |
Source: Public Records
Tax History Compared to Growth
Tax History
| Year | Tax Paid | Tax Assessment Tax Assessment Total Assessment is a certain percentage of the fair market value that is determined by local assessors to be the total taxable value of land and additions on the property. | Land | Improvement |
|---|---|---|---|---|
| 2025 | $5,517 | $222,200 | $83,600 | $138,600 |
| 2024 | $5,464 | $222,200 | $83,600 | $138,600 |
| 2023 | $5,231 | $222,200 | $83,600 | $138,600 |
| 2022 | $5,231 | $222,200 | $83,600 | $138,600 |
| 2021 | $5,159 | $222,200 | $83,600 | $138,600 |
| 2020 | $5,166 | $222,200 | $83,600 | $138,600 |
| 2019 | $5,093 | $222,200 | $83,600 | $138,600 |
| 2018 | $5,062 | $222,200 | $83,600 | $138,600 |
| 2017 | $5,235 | $222,500 | $85,800 | $136,700 |
| 2016 | $5,182 | $222,500 | $85,800 | $136,700 |
| 2015 | $5,000 | $222,500 | $85,800 | $136,700 |
| 2014 | $4,957 | $217,900 | $85,800 | $132,100 |
Source: Public Records
Map
Nearby Homes
- 157 Rodman Dr
- 129 Bruce Dr
- 124 Lee Dr
- 275 Jennings Rd
- 772 Jane Dr
- 174 Eileen Ln
- 812 Jane Dr
- 137 Anita Dr
- 157 Arthur Dr
- 104 Southard Dr
- 6 Ocean Breeze Ct
- 884 Mill Creek Rd
- 11 Betty Dr
- 77 Windward Dr
- 887 Beach Haven West Blvd
- 887 Beach Haven Blvd W
- 527 Mill Creek Rd
- 15 David Dr
- 36 David Dr
- 927 Beach Haven Blvd W