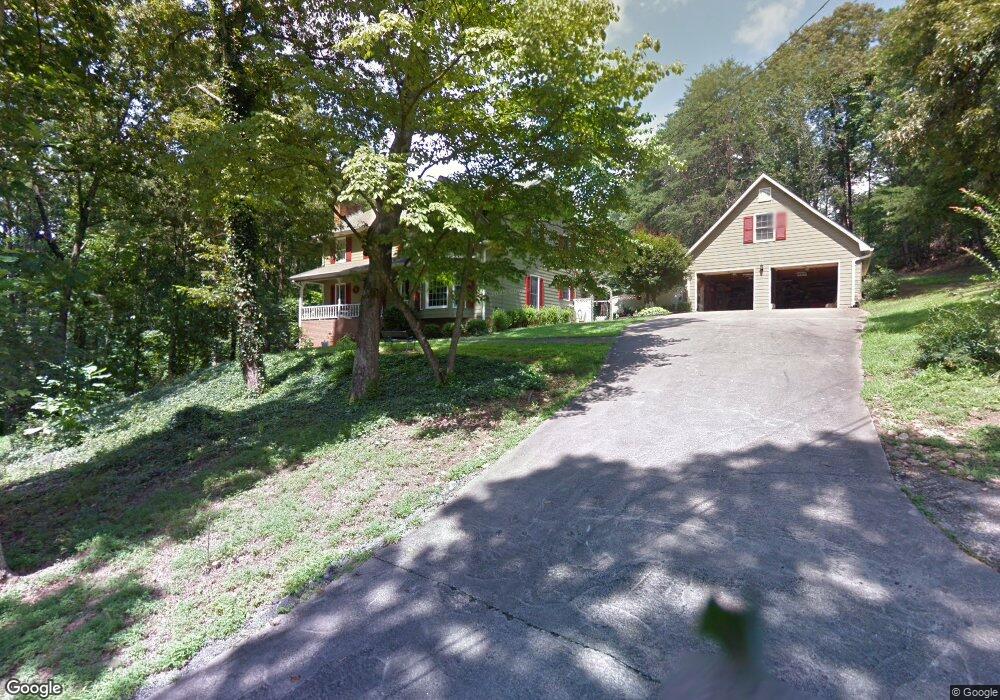
376 Mcrae Dr Unit A Canton, GA 30115
Estimated Value: $524,000 - $711,405
5
Beds
5
Baths
3,840
Sq Ft
$159/Sq Ft
Est. Value
About This Home
This home is located at 376 Mcrae Dr Unit A, Canton, GA 30115 and is currently estimated at $610,851, approximately $159 per square foot. 376 Mcrae Dr Unit A is a home located in Cherokee County with nearby schools including Indian Knoll Elementary School, Rusk Middle School, and Sequoyah High School.
Ownership History
Date
Name
Owned For
Owner Type
Purchase Details
Closed on
Apr 30, 2019
Sold by
Murphy Stephanie
Bought by
Haber Evelyn and Peterman Pamela
Current Estimated Value
Home Financials for this Owner
Home Financials are based on the most recent Mortgage that was taken out on this home.
Original Mortgage
$436,834
Outstanding Balance
$380,874
Interest Rate
4%
Mortgage Type
New Conventional
Estimated Equity
$229,977
Purchase Details
Closed on
Dec 16, 2016
Sold by
Sandra M
Bought by
Martin Anthony L and Martin Susan Renee
Purchase Details
Closed on
Jun 22, 2016
Sold by
Barber Sandra M
Bought by
Murphy Stephanie
Home Financials for this Owner
Home Financials are based on the most recent Mortgage that was taken out on this home.
Original Mortgage
$289,656
Interest Rate
4.5%
Mortgage Type
FHA
Create a Home Valuation Report for This Property
The Home Valuation Report is an in-depth analysis detailing your home's value as well as a comparison with similar homes in the area
Home Values in the Area
Average Home Value in this Area
Purchase History
| Date | Buyer | Sale Price | Title Company |
|---|---|---|---|
| Haber Evelyn | $310,500 | -- | |
| Martin Anthony L | $40,000 | -- | |
| Murphy Stephanie | $295,000 | -- |
Source: Public Records
Mortgage History
| Date | Status | Borrower | Loan Amount |
|---|---|---|---|
| Open | Haber Evelyn | $436,834 | |
| Previous Owner | Murphy Stephanie | $289,656 |
Source: Public Records
Tax History Compared to Growth
Tax History
| Year | Tax Paid | Tax Assessment Tax Assessment Total Assessment is a certain percentage of the fair market value that is determined by local assessors to be the total taxable value of land and additions on the property. | Land | Improvement |
|---|---|---|---|---|
| 2025 | $1,100 | $193,324 | $47,520 | $145,804 |
| 2024 | $1,062 | $179,364 | $38,360 | $141,004 |
| 2023 | $867 | $161,204 | $30,920 | $130,284 |
| 2022 | $973 | $137,644 | $29,680 | $107,964 |
| 2021 | $961 | $114,164 | $24,720 | $89,444 |
| 2020 | $2,906 | $104,484 | $24,720 | $79,764 |
| 2019 | $3,063 | $107,800 | $24,720 | $83,080 |
| 2018 | $2,998 | $104,880 | $24,720 | $80,160 |
| 2017 | $879 | $266,100 | $24,720 | $81,720 |
| 2016 | $879 | $234,700 | $39,680 | $54,200 |
| 2015 | $895 | $233,300 | $38,280 | $55,040 |
| 2014 | $814 | $212,500 | $31,200 | $53,800 |
Source: Public Records
Map
Nearby Homes
- 209 Forest Trace
- 201 Hillcrest Ridge
- 312 Hillcrest Ln
- 254 Hillcrest Ridge Unit 2
- 365 Russell King Ln
- 3548 Cherokee Overlook Dr
- 3714 Cherokee Overlook Dr Unit 2
- 832 Overlook Trail
- 302 and 304 Garland Way
- 3789 Cherokee Overlook Dr
- 240 Rose Ridge Dr
- 809 Overlook Trail
- 253 Newt Fowler Ln
- 727 Lower Scott Mill Rd
- 459 Lower Scott Mill Rd
- 701 Longview Dr
- 231 Breeze Hill Ln
- 1200 Tom Hulsey Dr
- 2790 Hickory Flat Hwy
- 120 E Killian St
- 376 Mcrae Dr Unit B
- 376 Mcrae Dr
- 334 Mcrae Dr
- 334 Mcrae Dr
- 215 Forest Trace Unit 215
- 215 Forest Trace
- 215 Forest Trace Unit 1
- 217 Forest Trace
- 260 Mountain Vista Blvd Unit 2
- 213 Forest Trace
- 1718 Hickory Flat Hwy
- 258 Mountain Vista Blvd Unit 2
- 258 Mountain Vista Blvd Unit 67
- 210 Forrester Ln
- 210 Forest Trace
- 282 Mcrae Dr
- 1718 Hickory Flat
- 211 Forest Trace Unit 5
- 211 Forest Trace
- 241 Mountain Vista Blvd