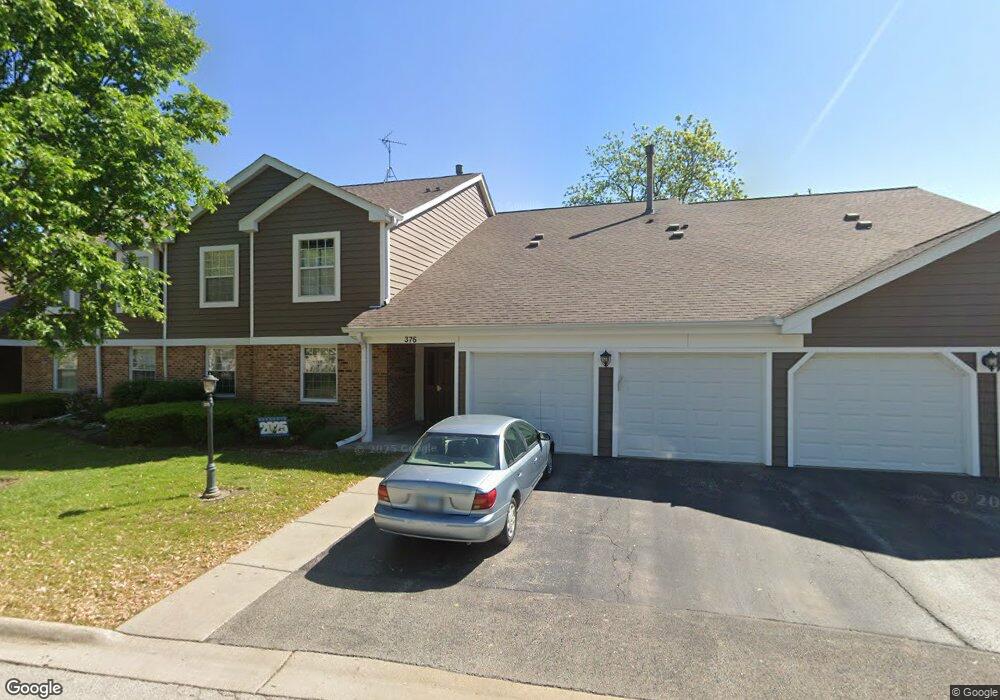
376 Newgate Ct Unit V1 Schaumburg, IL 60193
East Schaumburg NeighborhoodEstimated Value: $261,021 - $293,000
2
Beds
2
Baths
1,150
Sq Ft
$242/Sq Ft
Est. Value
About This Home
This home is located at 376 Newgate Ct Unit V1, Schaumburg, IL 60193 and is currently estimated at $278,005, approximately $241 per square foot. 376 Newgate Ct Unit V1 is a home located in Cook County with nearby schools including Michael Collins Elementary School, Robert Frost Junior High School, and J B Conant High School.
Ownership History
Date
Name
Owned For
Owner Type
Purchase Details
Closed on
Sep 9, 2010
Sold by
Federal Home Loan Mortgage Corporation
Bought by
Angelov Angel K and Angelov Rositsa
Current Estimated Value
Home Financials for this Owner
Home Financials are based on the most recent Mortgage that was taken out on this home.
Original Mortgage
$120,600
Outstanding Balance
$79,555
Interest Rate
4.42%
Mortgage Type
New Conventional
Estimated Equity
$198,450
Purchase Details
Closed on
Apr 29, 2010
Sold by
Lasalle Bank Na
Bought by
Federal Home Loan Mortgage Corp
Purchase Details
Closed on
Sep 8, 2000
Sold by
Dean Patricia Ann
Bought by
Feliciano Madeline D
Home Financials for this Owner
Home Financials are based on the most recent Mortgage that was taken out on this home.
Original Mortgage
$108,000
Interest Rate
7.75%
Create a Home Valuation Report for This Property
The Home Valuation Report is an in-depth analysis detailing your home's value as well as a comparison with similar homes in the area
Home Values in the Area
Average Home Value in this Area
Purchase History
| Date | Buyer | Sale Price | Title Company |
|---|---|---|---|
| Angelov Angel K | $134,000 | Attorneys Title Guaranty Fun | |
| Federal Home Loan Mortgage Corp | -- | None Available | |
| Feliciano Madeline D | $120,000 | -- |
Source: Public Records
Mortgage History
| Date | Status | Borrower | Loan Amount |
|---|---|---|---|
| Open | Angelov Angel K | $120,600 | |
| Previous Owner | Feliciano Madeline D | $108,000 |
Source: Public Records
Tax History Compared to Growth
Tax History
| Year | Tax Paid | Tax Assessment Tax Assessment Total Assessment is a certain percentage of the fair market value that is determined by local assessors to be the total taxable value of land and additions on the property. | Land | Improvement |
|---|---|---|---|---|
| 2024 | $3,947 | $17,406 | $3,533 | $13,873 |
| 2023 | $3,799 | $17,406 | $3,533 | $13,873 |
| 2022 | $3,799 | $17,406 | $3,533 | $13,873 |
| 2021 | $3,640 | $15,339 | $2,810 | $12,529 |
| 2020 | $3,645 | $15,339 | $2,810 | $12,529 |
| 2019 | $3,646 | $17,033 | $2,810 | $14,223 |
| 2018 | $2,537 | $11,890 | $2,248 | $9,642 |
| 2017 | $2,515 | $11,890 | $2,248 | $9,642 |
| 2016 | $2,595 | $11,890 | $2,248 | $9,642 |
| 2015 | $2,449 | $10,811 | $2,007 | $8,804 |
| 2014 | $2,439 | $10,811 | $2,007 | $8,804 |
| 2013 | $2,359 | $10,811 | $2,007 | $8,804 |
Source: Public Records
Map
Nearby Homes
- 350 Newgate Ct Unit 2Z
- 28 Ascot Cir
- 22 Ascot Cir
- 287 Pembridge Ln Unit B2
- 136 Wolcott Ct Unit O2
- 121 Chatsworth Cir
- 22 Waterbury Ln Unit N1
- 125 Cleveland Ct Unit M2
- 600 Eastview Ct Unit X1
- 147 Fulbright Ln
- 153 Fulbright Ln
- 601 Hanover Ct Unit Z2
- 609 Hanover Ct Unit X1
- 300 S Roselle Rd Unit 207
- 300 S Roselle Rd Unit 519
- 300 S Roselle Rd Unit 419
- 21 White Pine Dr
- 1871 Fox Run Dr Unit A
- 313 Lincoln St
- 751 Edgelake Point Unit 68C
- 376 Newgate Ct Unit 11346
- 376 Newgate Ct Unit 11346
- 376 Newgate Ct Unit 11346R
- 376 Newgate Ct Unit 11346
- 376 Newgate Ct Unit Z1
- 374 Newgate Ct Unit 11346
- 374 Newgate Ct Unit 11346
- 374 Newgate Ct Unit 11346
- 374 Newgate Ct Unit 11346
- 374 Newgate Ct Unit W1
- 374 Newgate Ct Unit X2
- 28 Stanton Ct Unit A2
- 28 Stanton Ct Unit 1935L
- 28 Stanton Ct Unit 1935L
- 28 Stanton Ct Unit 1935L
- 28 Stanton Ct Unit 1935L
- 28 Stanton Ct Unit 1B
- 28 Stanton Ct Unit B2
- 26 Stanton Ct Unit 1935R
- 26 Stanton Ct Unit 1935R