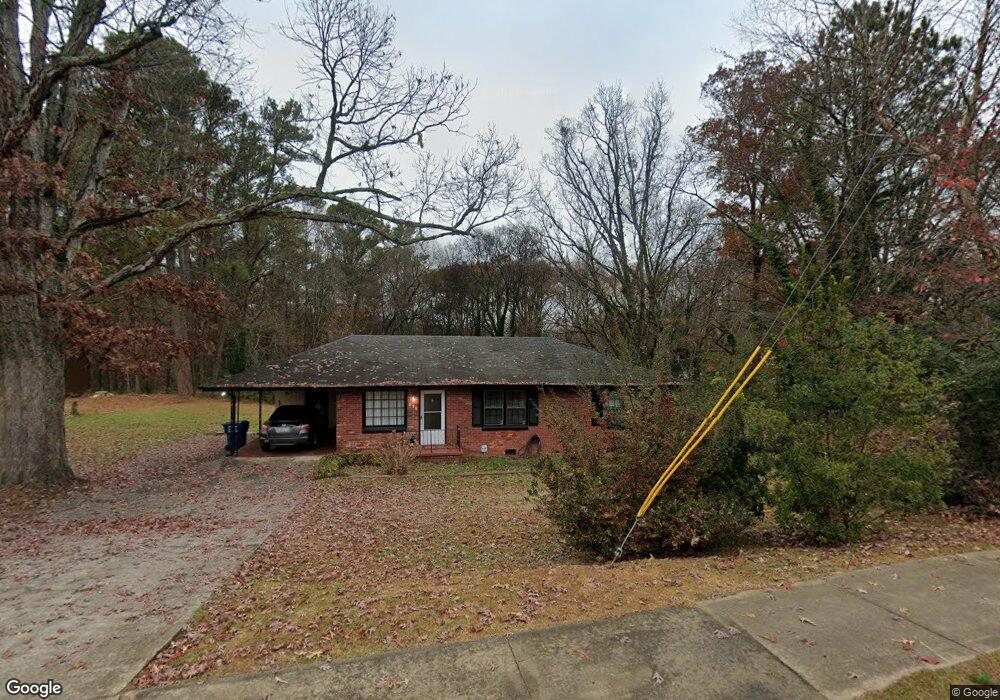
376 S Gordon Rd SW Unit 376 Mableton, GA 30126
Estimated Value: $184,000 - $254,000
3
Beds
2
Baths
1,050
Sq Ft
$213/Sq Ft
Est. Value
About This Home
This home is located at 376 S Gordon Rd SW Unit 376, Mableton, GA 30126 and is currently estimated at $223,980, approximately $213 per square foot. 376 S Gordon Rd SW Unit 376 is a home located in Cobb County with nearby schools including Riverside Primary School, Lindley Middle School, and Pebblebrook High School.
Ownership History
Date
Name
Owned For
Owner Type
Purchase Details
Closed on
Jan 25, 2019
Sold by
Cordia Homes I Llc
Bought by
Cordia Georgia 2 Llc
Current Estimated Value
Purchase Details
Closed on
May 24, 2013
Sold by
R & S Heath Homes Llc
Bought by
Cordia Georgia Llc
Purchase Details
Closed on
Nov 17, 2011
Sold by
Ramos Felipe
Bought by
R
Purchase Details
Closed on
Nov 21, 2001
Sold by
Sneeringer Mary L
Bought by
Ramos Felipe
Home Financials for this Owner
Home Financials are based on the most recent Mortgage that was taken out on this home.
Original Mortgage
$97,231
Interest Rate
6.5%
Mortgage Type
FHA
Purchase Details
Closed on
Aug 30, 1999
Sold by
Henderson Gene A and Henderson Vicki E
Bought by
Sneeringer Mary L
Home Financials for this Owner
Home Financials are based on the most recent Mortgage that was taken out on this home.
Original Mortgage
$86,200
Interest Rate
7.5%
Mortgage Type
New Conventional
Create a Home Valuation Report for This Property
The Home Valuation Report is an in-depth analysis detailing your home's value as well as a comparison with similar homes in the area
Home Values in the Area
Average Home Value in this Area
Purchase History
| Date | Buyer | Sale Price | Title Company |
|---|---|---|---|
| Cordia Georgia 2 Llc | -- | -- | |
| Cordia Georgia Llc | $43,200 | -- | |
| R | $31,000 | -- | |
| Ramos Felipe | $98,000 | -- | |
| Sneeringer Mary L | $88,900 | -- |
Source: Public Records
Mortgage History
| Date | Status | Borrower | Loan Amount |
|---|---|---|---|
| Previous Owner | Ramos Felipe | $97,231 | |
| Previous Owner | Sneeringer Mary L | $86,200 |
Source: Public Records
Tax History Compared to Growth
Tax History
| Year | Tax Paid | Tax Assessment Tax Assessment Total Assessment is a certain percentage of the fair market value that is determined by local assessors to be the total taxable value of land and additions on the property. | Land | Improvement |
|---|---|---|---|---|
| 2025 | $2,181 | $72,388 | $35,720 | $36,668 |
| 2024 | $2,183 | $72,388 | $35,720 | $36,668 |
| 2023 | $1,976 | $65,544 | $35,720 | $29,824 |
| 2022 | $1,427 | $47,008 | $22,560 | $24,448 |
| 2021 | $1,229 | $40,484 | $19,552 | $20,932 |
| 2020 | $1,092 | $35,972 | $15,040 | $20,932 |
| 2019 | $1,092 | $35,972 | $15,040 | $20,932 |
| 2018 | $849 | $27,980 | $8,648 | $19,332 |
| 2017 | $579 | $20,136 | $5,640 | $14,496 |
| 2016 | $579 | $20,136 | $5,640 | $14,496 |
| 2015 | $566 | $19,224 | $3,760 | $15,464 |
| 2014 | $513 | $17,268 | $0 | $0 |
Source: Public Records
Map
Nearby Homes
- 6837 Shenandoah Trail
- 6649 Valley Hill Dr SW
- 6650 Valley Hill Dr SW
- 6914 Fairway Trail
- 306 Bonnes Dr
- 6722 Armonia Dr
- Foxglove Plan at Leydenview
- Marigold Plan at Leydenview
- 6714 Armonia Dr
- 361 Gordon Valley Ln SW
- 6696 Armonia Dr
- 6692 Armonia Dr
- 6511 Gordon Hills Dr SW
- 365 Waterbluff Dr SW
- 6874 Bridgewood Dr
- 369 Waterbluff Dr SW
- 364 Waterbluff Dr SW
- 373 Waterbluff Dr SW
- 368 Waterbluff Dr SW
- Magnolia Plan at The Overlook at Factory Shoals - Georgian Series
- 376 S Gordon Rd SW
- 376 S Gordon Rd SW
- 0 S Gordon Rd Unit 10260681
- 0 S Gordon Rd Unit 7346331
- 0 S Gordon Rd Unit 5854228
- 388 S Gordon Rd SW
- 6755 Gordon Manor Ct SW
- 366 S Gordon Rd SW
- 400 S Gordon Rd SW
- 6750 Gordon Manor Ct SW
- 6765 Gordon Manor Ct SW
- 6760 Gordon Manor Ct SW
- 6723 Mitchell Ln SW
- 397 S Gordon Rd SW
- 340 S Gordon Rd SW
- 363 Donfred Dr SW
- 6709 Mitchell Ln SW
- 375 Donfred Dr SW
- 6785 Gordon Manor Ct SW
- 391 Donfred Dr SW