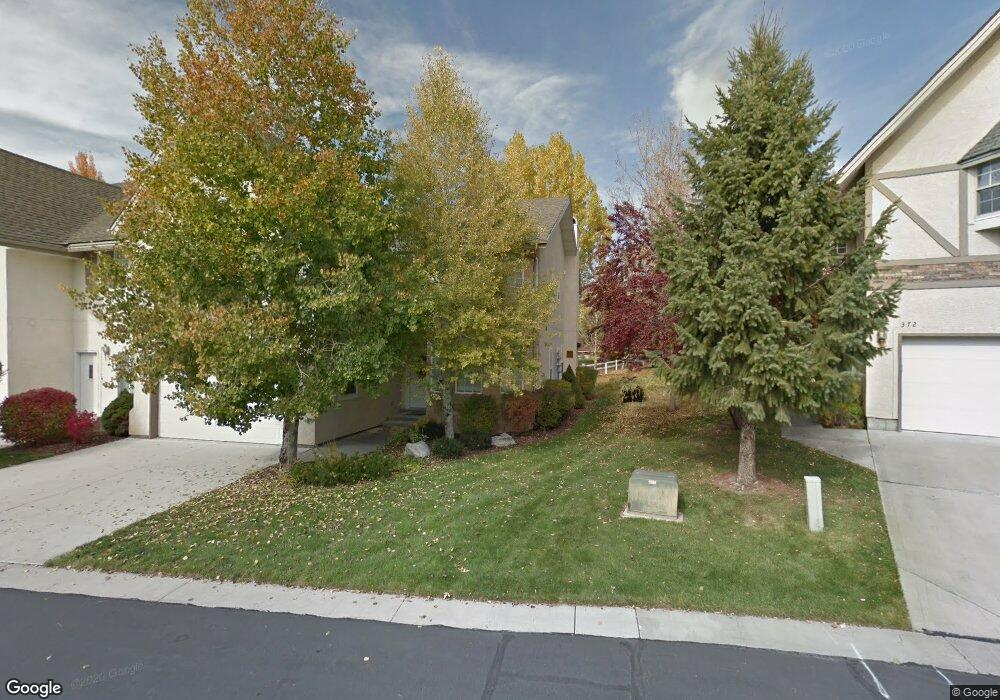
376 W Cottage Creek Ct Midway, UT 84049
Estimated Value: $741,000 - $960,000
3
Beds
3
Baths
3,300
Sq Ft
$252/Sq Ft
Est. Value
About This Home
This home is located at 376 W Cottage Creek Ct, Midway, UT 84049 and is currently estimated at $832,045, approximately $252 per square foot. 376 W Cottage Creek Ct is a home located in Wasatch County with nearby schools including Midway Elementary School, Rocky Mountain Middle School, and Wasatch High School.
Ownership History
Date
Name
Owned For
Owner Type
Purchase Details
Closed on
Sep 21, 2020
Sold by
Wasatch Front Re Investments Llc
Bought by
Sanatar Stefani L
Current Estimated Value
Home Financials for this Owner
Home Financials are based on the most recent Mortgage that was taken out on this home.
Original Mortgage
$408,000
Outstanding Balance
$362,073
Interest Rate
2.9%
Mortgage Type
New Conventional
Estimated Equity
$469,972
Purchase Details
Closed on
Jul 6, 2020
Sold by
Utah Sell Now Llc
Bought by
Wasatch Front Re Investments Llc
Purchase Details
Closed on
Jan 10, 2020
Sold by
Gordon Bonnie E
Bought by
Utah Sell Now Llc
Home Financials for this Owner
Home Financials are based on the most recent Mortgage that was taken out on this home.
Original Mortgage
$170,352
Interest Rate
3.6%
Mortgage Type
Commercial
Purchase Details
Closed on
Dec 5, 2006
Sold by
Lowe Richard and Lowe Julia P
Bought by
Lutz Ron and Lutz Sally
Create a Home Valuation Report for This Property
The Home Valuation Report is an in-depth analysis detailing your home's value as well as a comparison with similar homes in the area
Home Values in the Area
Average Home Value in this Area
Purchase History
| Date | Buyer | Sale Price | Title Company |
|---|---|---|---|
| Sanatar Stefani L | -- | Title Services Park City | |
| Wasatch Front Re Investments Llc | -- | Title Guarantee | |
| Utah Sell Now Llc | -- | Title Guarantee | |
| Lutz Ron | -- | Founders Title Company Heber |
Source: Public Records
Mortgage History
| Date | Status | Borrower | Loan Amount |
|---|---|---|---|
| Open | Sanatar Stefani L | $408,000 | |
| Previous Owner | Utah Sell Now Llc | $170,352 |
Source: Public Records
Tax History Compared to Growth
Tax History
| Year | Tax Paid | Tax Assessment Tax Assessment Total Assessment is a certain percentage of the fair market value that is determined by local assessors to be the total taxable value of land and additions on the property. | Land | Improvement |
|---|---|---|---|---|
| 2025 | $3,581 | $706,580 | $125,000 | $581,580 |
| 2024 | $3,541 | $706,580 | $125,000 | $581,580 |
| 2023 | $3,541 | $592,208 | $125,000 | $467,208 |
| 2022 | $3,266 | $592,208 | $125,000 | $467,208 |
| 2021 | $2,591 | $363,141 | $70,000 | $293,141 |
| 2020 | $2,673 | $363,141 | $70,000 | $293,141 |
| 2019 | $3,109 | $199,728 | $0 | $0 |
| 2018 | $2,444 | $199,728 | $0 | $0 |
| 2017 | $2,215 | $179,928 | $0 | $0 |
| 2016 | $2,112 | $167,334 | $0 | $0 |
| 2015 | $3,649 | $304,243 | $70,000 | $234,243 |
| 2014 | $4,103 | $328,776 | $70,000 | $258,776 |
Source: Public Records
Map
Nearby Homes
- 404 Cottage Creek Ct
- 320 Pine Canyon Rd
- 520 Pine Canyon Rd
- 447 N Fairway Dr
- 550 Pine Canyon Rd
- 360 W 200 N
- 146 E Altamont Dr
- 285 W Burnts Field Rd
- 670 W 200 N
- 623 N Center St
- 116 E Hampton Dr Unit 4
- 33 N 200 W
- 48 E 400 N
- 48 Dairy Ln
- 271 W Main St
- 741 Bigler Ln
- 747 Bigler Ln Unit 4
- 747 Bigler Ln
- 757 Bigler Ln
- 836 N Pinehurst Dr
- 376 Cottage Creek Ct
- 376 Cottage Creek Ct Unit 8
- 380 Cottage Creek Ct
- 372 W Cottage Creek Ct Unit 25
- 372 W Cottage Creek Ct Unit 7
- 372 W Cottage Creek Ct Unit 372
- 372 Cottage Creek Ct
- 372 Cottage Creek Ct Unit 372
- 372 Cottage Creek Ct Unit 7
- 368 Cottage Creek Ct
- 368 Cottage Creek Ct Unit 368
- 368 Cottage Creek Ct Unit 6
- 388 Cottage Creek Ct
- 388 Cottage Creek Ct Unit LOT 11
- 369 Cottage Creek Ct
- 364 Cottage Creek Ct
- 364 Cottage Creek Ct Unit 5
- 364 Cottage Ct
- 392 W Cottage Creek Ct Unit 12
- 392 Cottage Creek Ct