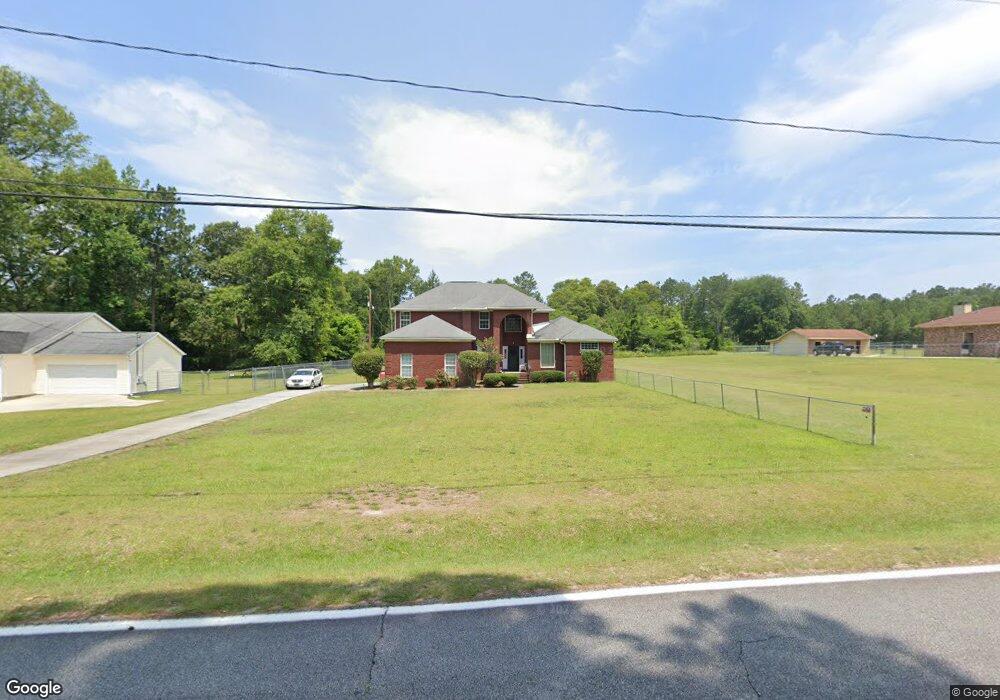
3760 Hitchcock Rd Macon, GA 31217
Estimated Value: $166,000 - $292,000
4
Beds
3
Baths
3,015
Sq Ft
$80/Sq Ft
Est. Value
About This Home
This home is located at 3760 Hitchcock Rd, Macon, GA 31217 and is currently estimated at $240,174, approximately $79 per square foot. 3760 Hitchcock Rd is a home located in Bibb County with nearby schools including Bernd Elementary School, Appling Middle School, and Northeast High School.
Ownership History
Date
Name
Owned For
Owner Type
Purchase Details
Closed on
Nov 10, 2010
Sold by
Fannie Mae
Bought by
King Cherry A
Current Estimated Value
Purchase Details
Closed on
Sep 7, 2010
Sold by
Foster Leroy Thomas
Bought by
Litton Loan Servicing Lp
Purchase Details
Closed on
Oct 27, 2005
Sold by
Gordon Cecil
Bought by
Foster Leroy Thomas
Home Financials for this Owner
Home Financials are based on the most recent Mortgage that was taken out on this home.
Original Mortgage
$153,000
Interest Rate
5.71%
Mortgage Type
Construction
Create a Home Valuation Report for This Property
The Home Valuation Report is an in-depth analysis detailing your home's value as well as a comparison with similar homes in the area
Home Values in the Area
Average Home Value in this Area
Purchase History
| Date | Buyer | Sale Price | Title Company |
|---|---|---|---|
| King Cherry A | $65,000 | None Available | |
| Litton Loan Servicing Lp | $251,600 | -- | |
| Federal National Mortgage Association | $251,626 | None Available | |
| Litton Loan Servicing Lp | $251,625 | None Available | |
| Foster Leroy Thomas | $5,000 | None Available |
Source: Public Records
Mortgage History
| Date | Status | Borrower | Loan Amount |
|---|---|---|---|
| Previous Owner | Foster Leroy Thomas | $153,000 |
Source: Public Records
Tax History Compared to Growth
Tax History
| Year | Tax Paid | Tax Assessment Tax Assessment Total Assessment is a certain percentage of the fair market value that is determined by local assessors to be the total taxable value of land and additions on the property. | Land | Improvement |
|---|---|---|---|---|
| 2025 | $2,751 | $118,956 | $3,750 | $115,206 |
| 2024 | $2,843 | $118,956 | $3,750 | $115,206 |
| 2023 | $3,316 | $118,956 | $3,750 | $115,206 |
| 2022 | $2,105 | $67,795 | $3,716 | $64,079 |
| 2021 | $2,310 | $67,795 | $3,716 | $64,079 |
| 2020 | $2,360 | $67,795 | $3,716 | $64,079 |
| 2019 | $2,107 | $61,387 | $3,716 | $57,671 |
| 2018 | $4,051 | $71,564 | $3,716 | $67,848 |
| 2017 | $2,419 | $71,564 | $3,716 | $67,848 |
| 2016 | $2,234 | $71,564 | $3,716 | $67,848 |
| 2015 | $3,162 | $71,564 | $3,716 | $67,848 |
| 2014 | $3,167 | $71,564 | $3,716 | $67,848 |
Source: Public Records
Map
Nearby Homes
- 3750 Hitchcock Rd
- 3770 Hitchcock Rd
- 3784 Hitchcock Rd
- 3740 Hitchcock Rd
- 3755 Hitchcock Rd
- 3767 Hitchcock Rd
- 3800 Hitchcock Rd
- 3732 Hitchcock Rd
- 3775 Hitchcock Rd
- 0 Hitchcock Rd
- 3785 Hitchcock Rd
- 3656 Piedmont Cir
- 3386 Kings Park Cir
- 3368 Kings Park Cir
- 3369 Kings Park Cir
- 3809 Hitchcock Rd
- 3734 Irwinton Rd
- 3740 Irwinton Rd
- 3648 Piedmont Cir
- 3726 Irwinton Rd