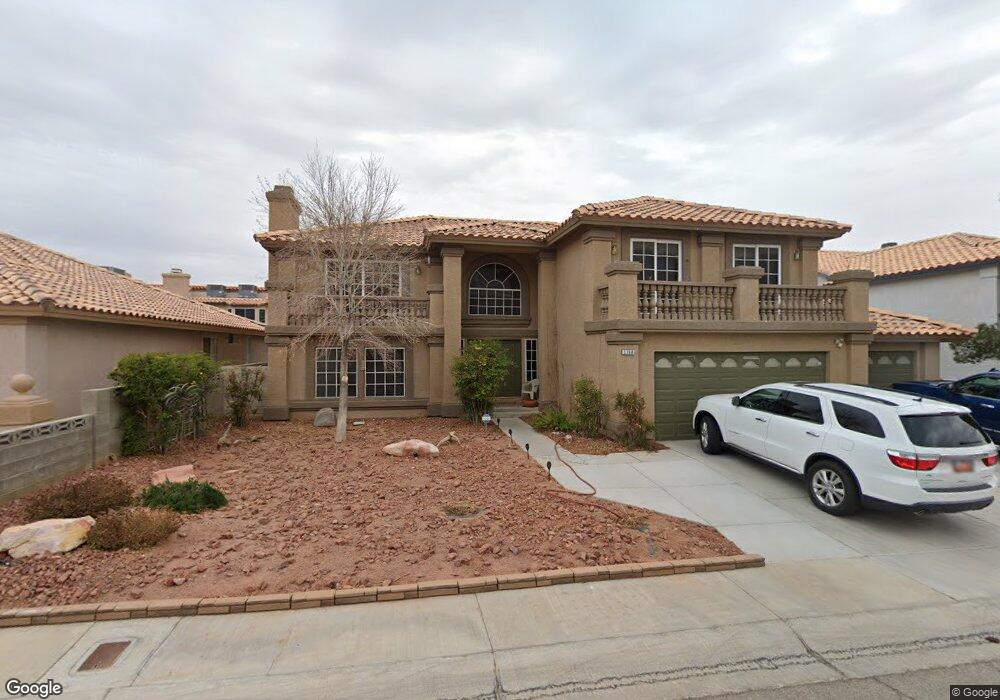
3760 Moss Ridge Ct Las Vegas, NV 89147
Rancho Viejo NeighborhoodEstimated Value: $685,169 - $709,000
5
Beds
3
Baths
3,557
Sq Ft
$196/Sq Ft
Est. Value
About This Home
This home is located at 3760 Moss Ridge Ct, Las Vegas, NV 89147 and is currently estimated at $698,042, approximately $196 per square foot. 3760 Moss Ridge Ct is a home located in Clark County with nearby schools including Patricia A Bendorf Elementary School, Clifford J Lawrence Junior High School, and Spring Valley High School.
Ownership History
Date
Name
Owned For
Owner Type
Purchase Details
Closed on
Mar 10, 2015
Sold by
Adams Randy
Bought by
The Adams Family Trust
Current Estimated Value
Purchase Details
Closed on
May 26, 2004
Sold by
Heward Dale and Heward Shelly N
Bought by
Adams Randy
Home Financials for this Owner
Home Financials are based on the most recent Mortgage that was taken out on this home.
Original Mortgage
$200,000
Outstanding Balance
$126,099
Interest Rate
10.64%
Mortgage Type
Unknown
Estimated Equity
$571,943
Purchase Details
Closed on
May 24, 2004
Sold by
Adams June
Bought by
Adams Randy
Home Financials for this Owner
Home Financials are based on the most recent Mortgage that was taken out on this home.
Original Mortgage
$200,000
Outstanding Balance
$126,099
Interest Rate
10.64%
Mortgage Type
Unknown
Estimated Equity
$571,943
Create a Home Valuation Report for This Property
The Home Valuation Report is an in-depth analysis detailing your home's value as well as a comparison with similar homes in the area
Home Values in the Area
Average Home Value in this Area
Purchase History
| Date | Buyer | Sale Price | Title Company |
|---|---|---|---|
| The Adams Family Trust | -- | None Available | |
| Adams Randy | $256,310 | Fidelity National Title | |
| Adams Randy | -- | Fidelity National Title |
Source: Public Records
Mortgage History
| Date | Status | Borrower | Loan Amount |
|---|---|---|---|
| Open | Adams Randy | $200,000 |
Source: Public Records
Tax History Compared to Growth
Tax History
| Year | Tax Paid | Tax Assessment Tax Assessment Total Assessment is a certain percentage of the fair market value that is determined by local assessors to be the total taxable value of land and additions on the property. | Land | Improvement |
|---|---|---|---|---|
| 2025 | $3,232 | $163,273 | $63,700 | $99,573 |
| 2024 | $3,138 | $163,273 | $63,700 | $99,573 |
| 2023 | $3,138 | $154,741 | $59,150 | $95,591 |
| 2022 | $3,047 | $132,296 | $44,800 | $87,496 |
| 2021 | $2,958 | $125,624 | $42,000 | $83,624 |
| 2020 | $2,869 | $125,157 | $42,000 | $83,157 |
| 2019 | $2,834 | $119,148 | $36,750 | $82,398 |
| 2018 | $2,704 | $110,542 | $31,500 | $79,042 |
| 2017 | $3,223 | $109,887 | $29,400 | $80,487 |
| 2016 | $2,531 | $103,764 | $23,100 | $80,664 |
| 2015 | $2,526 | $83,408 | $19,600 | $63,808 |
| 2014 | $2,448 | $85,378 | $17,500 | $67,878 |
Source: Public Records
Map
Nearby Homes
- 3774 Emerald Bay Cir
- 8886 Blake Alan Ave
- 3691 Luminal Ln
- 3609 Calico Cove Ct
- 8887 Mia Moore Ave
- 8983 Emerald Waters Ct
- 9272 W Viking Rd
- 9070 Spring Mountain Rd Unit S202
- 9070 Spring Mountain Rd Unit 114
- 3559 S Dapple Gray Rd
- 3450 Erva St Unit 250
- 3450 Erva St Unit 207
- 3730 Ruskin St
- 3455 Erva St Unit 219
- 3891 Lilac Haze St
- 9270 Apache Springs Dr
- 8753 Fountain Island Dr
- 9334 Peace Pipe Ct
- 3930 Starfield Ln Unit O58
- 8638 White River Dr
- 3750 Moss Ridge Ct
- 3770 Moss Ridge Ct
- 3759 Amber Lantern Cir
- 3749 Amber Lantern Cir
- 3740 Moss Ridge Ct
- 3761 Moss Ridge Ct
- 3751 Moss Ridge Ct
- 3771 Moss Ridge Ct
- 3739 Amber Lantern Cir
- 3741 Moss Ridge Ct
- 9051 Fawn Grove Dr
- 9039 Fawn Grove Dr
- 3730 Moss Ridge Ct
- 9063 Fawn Grove Dr
- 9027 Fawn Grove Dr
- 3729 Amber Lantern Cir
- 3729 Amber Lantern Cir Unit 3729
- 3729 Amber Lantern Cir Unit 999
- 3762 Lone Mesa Dr