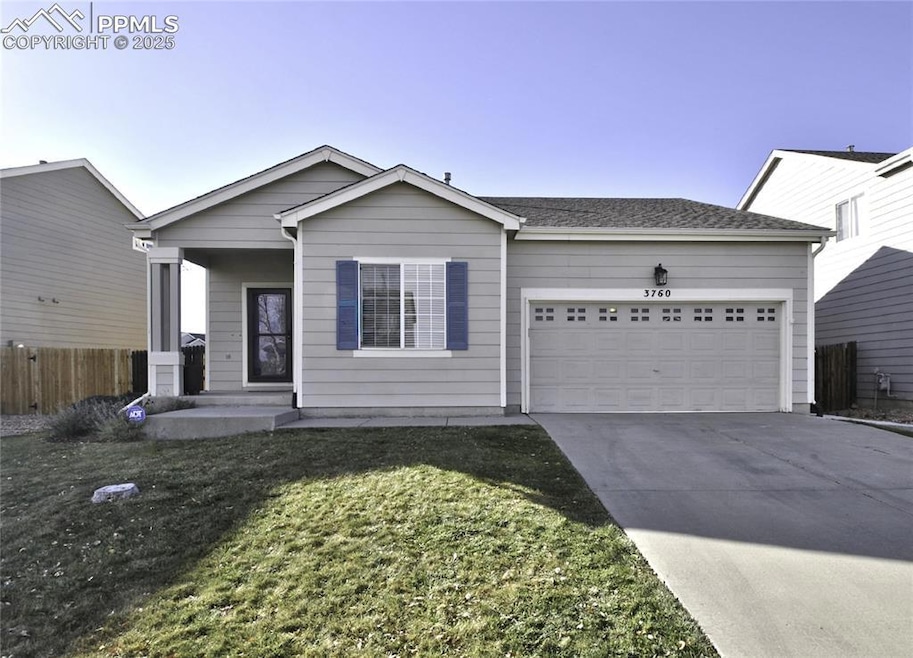
3760 Range Dr Colorado Springs, CO 80922
Springs Ranch NeighborhoodEstimated payment $2,294/month
Highlights
- Popular Property
- Ranch Style House
- Concrete Porch or Patio
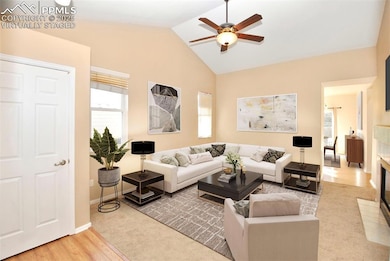
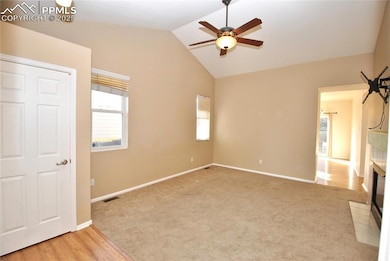
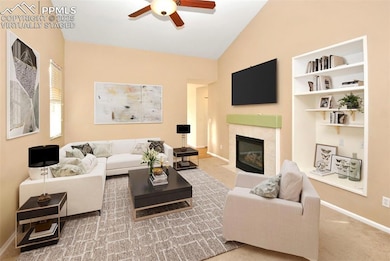
- Vaulted Ceiling
- 2 Car Attached Garage
- French Doors
About This Home
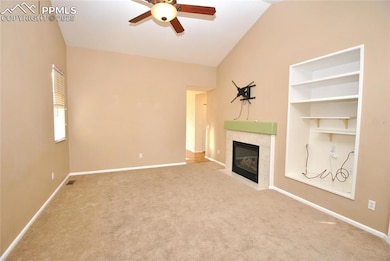
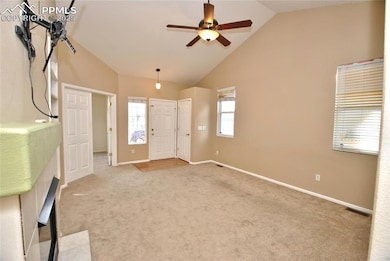
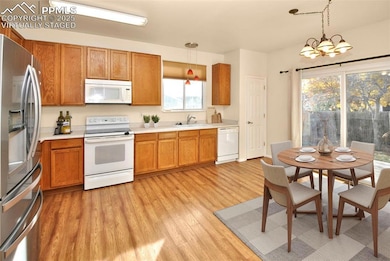
Welcome to this popular ranch style home offering true main level living. Located in a desirable Springs Ranch neighborhood. The Living Room features vaulted ceilings, and a gas fireplace, and built-ins for all your electronics. Spacious kitchen has plenty of cabinets and counter space, and a pantry. Kitchen also has an eat-in dining area, and walks out onto the patio with a fenced in backyard for privacy. Large master bedroom with a walk in closet, and an attached private 3/4 bath. 2 more bedrooms occupy the main level as well as a full bath. The third bedroom has French doors and would make a perfect office space. Central air conditioning, sprinkler system, concrete patio and more. Easy access to all military bases, schools, parks, restaurants and shopping. DON'T MISS OUT ON THIS GEM!
Home Details
Home Type
- Single Family
Est. Annual Taxes
- $1,436
Year Built
- Built in 2001
Lot Details
- 5,719 Sq Ft Lot
- Back Yard Fenced
- Level Lot
HOA Fees
- $13 Monthly HOA Fees
Parking
- 2 Car Attached Garage
- Garage Door Opener
- Driveway
Home Design
- Ranch Style House
- Shingle Roof
- Masonite
Interior Spaces
- 1,295 Sq Ft Home
- Vaulted Ceiling
- Gas Fireplace
- French Doors
- Crawl Space
Kitchen
- Microwave
- Dishwasher
- Disposal
Flooring
- Carpet
- Tile
Bedrooms and Bathrooms
- 3 Bedrooms
Outdoor Features
- Concrete Porch or Patio
Schools
- Remington Elementary School
- Horizon Middle School
- Sand Creek High School
Utilities
- Forced Air Heating and Cooling System
- Heating System Uses Natural Gas
Community Details
- Association fees include covenant enforcement
Map
Home Values in the Area
Average Home Value in this Area
Tax History
| Year | Tax Paid | Tax Assessment Tax Assessment Total Assessment is a certain percentage of the fair market value that is determined by local assessors to be the total taxable value of land and additions on the property. | Land | Improvement |
|---|---|---|---|---|
| 2025 | $1,436 | $29,860 | -- | -- |
| 2024 | $1,337 | $28,070 | $4,620 | $23,450 |
| 2023 | $1,337 | $28,070 | $4,620 | $23,450 |
| 2022 | $1,150 | $19,730 | $4,170 | $15,560 |
| 2021 | $1,199 | $20,300 | $4,290 | $16,010 |
| 2020 | $1,006 | $16,830 | $3,580 | $13,250 |
| 2019 | $995 | $16,830 | $3,580 | $13,250 |
| 2018 | $822 | $13,630 | $3,020 | $10,610 |
| 2017 | $827 | $13,630 | $3,020 | $10,610 |
| 2016 | $866 | $14,080 | $2,950 | $11,130 |
| 2015 | $867 | $14,080 | $2,950 | $11,130 |
| 2014 | $751 | $11,960 | $2,790 | $9,170 |
Property History
| Date | Event | Price | List to Sale | Price per Sq Ft |
|---|---|---|---|---|
| 11/06/2025 11/06/25 | For Sale | $410,000 | -- | $317 / Sq Ft |
Purchase History
| Date | Type | Sale Price | Title Company |
|---|---|---|---|
| Administrators Deed | $385,000 | None Listed On Document | |
| Quit Claim Deed | -- | Unified Title Co | |
| Warranty Deed | $187,000 | Empire Title Co Springs Llc | |
| Warranty Deed | $255,000 | Unified Title Co | |
| Interfamily Deed Transfer | -- | None Available | |
| Warranty Deed | $179,900 | Security Title | |
| Warranty Deed | $164,000 | First American | |
| Warranty Deed | $141,135 | Stewart Title |
Mortgage History
| Date | Status | Loan Amount | Loan Type |
|---|---|---|---|
| Open | $371,022 | VA | |
| Previous Owner | $149,600 | New Conventional | |
| Previous Owner | $180,000 | VA | |
| Previous Owner | $186,451 | VA | |
| Previous Owner | $183,750 | VA | |
| Previous Owner | $161,466 | FHA | |
| Previous Owner | $145,369 | VA |
Source: Pikes Peak REALTOR® Services
MLS Number: 5682335
APN: 53293-14-038
Disclaimer: Certain information contained herein is derived from information provided by parties other than Homes.com. All information provided is deemed reliable, but is not guaranteed to be accurate and should be independently verified.
![]() IDX information is provided exclusively for personal, non-commercial use, and may not be used for any purpose other than to identify prospective properties consumers may be interested in purchasing. Information is deemed reliable but not guaranteed.
IDX information is provided exclusively for personal, non-commercial use, and may not be used for any purpose other than to identify prospective properties consumers may be interested in purchasing. Information is deemed reliable but not guaranteed.
- 3617 Vineyard Cir
- 3889 Pioneer Creek Dr
- 3863 Vineyard Cir
- 7131 Mcewan St
- 3905 Reindeer Cir
- 3978 Pronghorn Meadows Cir
- 4126 Fellsland Dr
- 4148 Heathmoor Dr
- 4157 Ascendant Dr
- 3944 Ryedale Way
- 3320 Waverly Ln
- Trinity Plan at Windermere - 3500 Series
- 4029 Ryedale Way
- 7356 Waterman Way
- 3836 Tee Shot Dr
- 4019 Roan Dr
- 7215 Amber Ridge Dr
- 4013 Patterdale Place
- 4237 Stonesthrow View
- 4307 Addax Ct
- 7171 Saddle Up Dr
- 3822 Pronghorn Meadows Cir
- 6980 Mcewan St
- 4142 Heathmoor Dr
- 7023 Bonnie Brae Ln
- 7688 Mardale Ln
- 4028 Ryedale Way
- 3975 Ryedale Way
- 3934 Wyedale Way
- 7220 Grand Cascade Point
- 3921 Wyedale Way
- 4047 Wyedale Way
- 3732 Riviera Grove Unit 201
- 7320 Allens Park Dr
- 6416 Range Overlook Heights
- 7170 Allens Park Dr
- 6985 Battle Mountain Rd
- 3620 Richmond Dr
- 3620 Richmond Dr Unit 1
- 3755 Tutt Blvd
