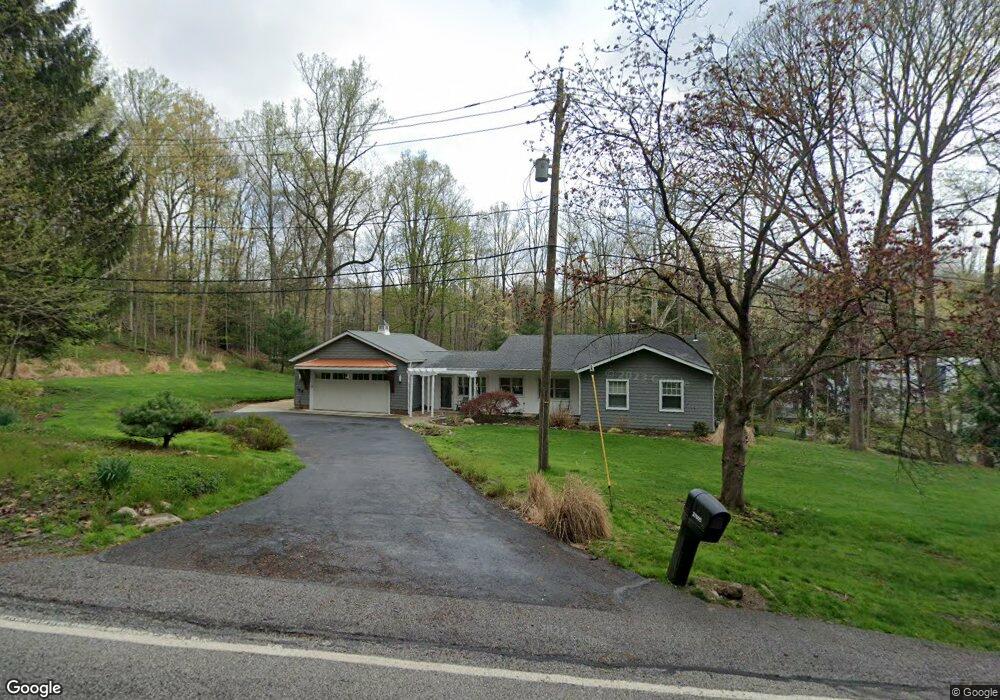
37605 Jackson Rd Chagrin Falls, OH 44022
Estimated Value: $385,000 - $538,000
3
Beds
2
Baths
1,468
Sq Ft
$304/Sq Ft
Est. Value
About This Home
This home is located at 37605 Jackson Rd, Chagrin Falls, OH 44022 and is currently estimated at $446,099, approximately $303 per square foot. 37605 Jackson Rd is a home located in Cuyahoga County with nearby schools including Gurney Elementary School, Chagrin Falls Intermediate Elementary School, and Chagrin Falls Middle School.
Ownership History
Date
Name
Owned For
Owner Type
Purchase Details
Closed on
Apr 8, 2025
Sold by
Stannert Lauren L and Stannert Brandon William
Bought by
William And Lauren Brandon Family Trust and Brandon
Current Estimated Value
Purchase Details
Closed on
Mar 20, 1999
Sold by
Keeter Jeanne R
Bought by
Brandon William Mckinley and Stannert Lauren L
Home Financials for this Owner
Home Financials are based on the most recent Mortgage that was taken out on this home.
Original Mortgage
$176,800
Interest Rate
6.85%
Purchase Details
Closed on
Aug 15, 1990
Sold by
Keeter George L
Bought by
Keeter Jeanne R
Purchase Details
Closed on
Dec 20, 1983
Sold by
Keeter George L and Keeter Jeanne R
Bought by
Keeter George L
Purchase Details
Closed on
Jan 1, 1975
Bought by
Keeter George L and Keeter Jeanne R
Create a Home Valuation Report for This Property
The Home Valuation Report is an in-depth analysis detailing your home's value as well as a comparison with similar homes in the area
Home Values in the Area
Average Home Value in this Area
Purchase History
| Date | Buyer | Sale Price | Title Company |
|---|---|---|---|
| William And Lauren Brandon Family Trust | -- | None Listed On Document | |
| Brandon William Mckinley | $221,000 | Rockwell Title Agency Inc | |
| Keeter Jeanne R | -- | Rockwell Title Agency Inc | |
| Keeter Jeanne R | -- | Rockwell Title Agency Inc | |
| Keeter Jeanne R | -- | -- | |
| Keeter George L | -- | -- | |
| Keeter George L | -- | -- |
Source: Public Records
Mortgage History
| Date | Status | Borrower | Loan Amount |
|---|---|---|---|
| Previous Owner | Brandon William Mckinley | $176,800 |
Source: Public Records
Tax History
| Year | Tax Paid | Tax Assessment Tax Assessment Total Assessment is a certain percentage of the fair market value that is determined by local assessors to be the total taxable value of land and additions on the property. | Land | Improvement |
|---|---|---|---|---|
| 2025 | $7,747 | $119,700 | $29,400 | $90,300 |
| 2024 | $7,831 | $119,700 | $29,400 | $90,300 |
| 2023 | $7,346 | $98,670 | $31,400 | $67,270 |
| 2022 | $7,754 | $98,670 | $31,400 | $67,270 |
| 2021 | $7,722 | $98,670 | $31,400 | $67,270 |
| 2020 | $7,337 | $87,330 | $27,790 | $59,540 |
| 2019 | $7,232 | $249,500 | $79,400 | $170,100 |
| 2018 | $3,563 | $86,520 | $27,790 | $58,730 |
| 2017 | $6,846 | $82,460 | $25,200 | $57,260 |
| 2016 | $6,109 | $82,460 | $25,200 | $57,260 |
| 2015 | $5,798 | $82,460 | $25,200 | $57,260 |
| 2014 | $5,798 | $77,080 | $23,560 | $53,520 |
Source: Public Records
Map
Nearby Homes
- 60 South Ln
- 3940 Ellendale Rd
- 3901 Ellendale Rd
- 4775 Som Center Rd
- 38080 Berkeley Ave
- 3812 Ellendale Rd
- 35320 Chagrin Blvd
- 5151 Som Center Rd
- 5009 Lansdowne Dr
- 318 Hillside Ln
- 26 Water St
- 81 Hall St
- 35 Hopewell Trail
- 33300 S Woodland Rd
- 312 Woodridge Ln
- 336 Woodridge Ln
- 270 North St
- 145 Greenbrier Dr
- 6331 Chagrin River Rd
- 110 Emilia Ct
- 10 Trolley Trail
- 37500 Jackson Rd
- 37475 Jackson Rd
- 70 Trolley Trail
- 37855 Jackson Rd
- 37355 Jackson Rd
- 37255 Jackson Rd
- S/L A Jackson Rd
- S/L A S L A Rd
- 37800 Jackson Rd
- 4450 Giles Rd
- 37150 Jackson Rd
- 37125 Jackson Rd
- 4355 Giles Rd
- 4295 Giles Rd
- 4240 Giles Rd
- 4425 Giles Rd
- 175 Hickory Ln
- 37850 Jackson Rd
- 4200 Giles Rd
Your Personal Tour Guide
Ask me questions while you tour the home.