Estimated Value: $135,000 - $639,000
1
Bed
1
Bath
430
Sq Ft
$1,050/Sq Ft
Est. Value
About This Home
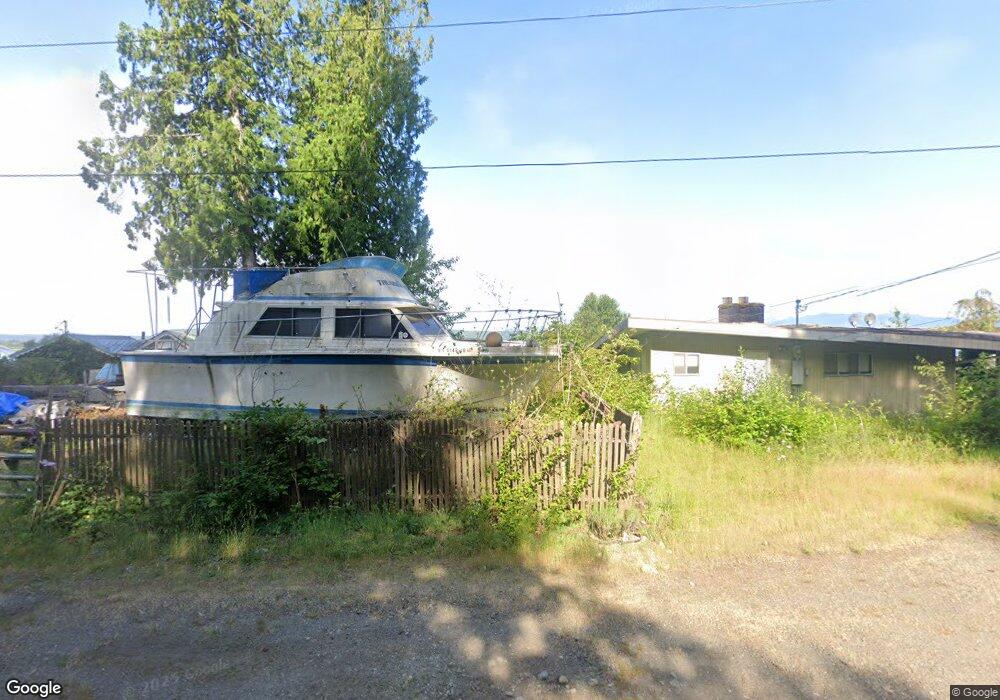
This home is located at 3761 E State Route 106, Union, WA 98592 and is currently estimated at $451,338, approximately $1,049 per square foot. 3761 E State Route 106 is a home located in Mason County with nearby schools including Hood Canal Elementary/Junior High School.
Ownership History
Date
Name
Owned For
Owner Type
Purchase Details
Closed on
Jun 22, 2021
Sold by
Katherine Whittington Mary
Bought by
Whittington Russel
Current Estimated Value
Home Financials for this Owner
Home Financials are based on the most recent Mortgage that was taken out on this home.
Original Mortgage
$168,500
Interest Rate
2.9%
Mortgage Type
New Conventional
Purchase Details
Closed on
Jun 21, 2021
Sold by
Whittington Randall Richard and Whittington Russell John
Bought by
Swanson Marie E
Home Financials for this Owner
Home Financials are based on the most recent Mortgage that was taken out on this home.
Original Mortgage
$168,500
Interest Rate
2.9%
Mortgage Type
New Conventional
Purchase Details
Closed on
Jul 27, 2009
Sold by
Williams John D
Bought by
Williams John D and John D Williams 2003 Trust
Purchase Details
Closed on
Nov 17, 2005
Sold by
Kityk Jerry
Bought by
Whittington Mary Kay and Talianis Suzanne
Purchase Details
Closed on
Nov 1, 2005
Sold by
Williams John D
Bought by
Kityk Jerry and Williams Family 2000 Trust
Create a Home Valuation Report for This Property
The Home Valuation Report is an in-depth analysis detailing your home's value as well as a comparison with similar homes in the area
Purchase History
| Date | Buyer | Sale Price | Title Company |
|---|---|---|---|
| Whittington Russel | -- | -- | |
| Whittington Russel | -- | -- | |
| Swanson Marie E | $212,000 | Aegis Land Title Group | |
| Swanson Marie E | -- | New Title Company Name | |
| Williams John D | -- | None Available | |
| Whittington Mary Kay | -- | None Available | |
| Kityk Jerry | -- | None Available |
Source: Public Records
Mortgage History
| Date | Status | Borrower | Loan Amount |
|---|---|---|---|
| Previous Owner | Swanson Marie E | $168,500 |
Source: Public Records
Tax History
| Year | Tax Paid | Tax Assessment Tax Assessment Total Assessment is a certain percentage of the fair market value that is determined by local assessors to be the total taxable value of land and additions on the property. | Land | Improvement |
|---|---|---|---|---|
| 2025 | $2,991 | $445,430 | $400,855 | $44,575 |
| 2023 | $2,991 | $393,570 | $355,375 | $38,195 |
| 2022 | $2,248 | $245,120 | $215,640 | $29,480 |
| 2021 | $2,574 | $245,120 | $215,640 | $29,480 |
| 2020 | $1,885 | $251,100 | $222,290 | $28,810 |
| 2018 | $1,696 | $161,400 | $134,610 | $26,790 |
| 2017 | $1,457 | $161,355 | $134,565 | $26,790 |
| 2016 | $1,458 | $145,285 | $121,990 | $23,295 |
| 2015 | $1,476 | $149,150 | $125,765 | $23,385 |
| 2014 | -- | $149,060 | $125,765 | $23,295 |
| 2013 | -- | $125,530 | $70,500 | $55,030 |
Source: Public Records
Map
Nearby Homes
- 0 E Gerbing View Dr Unit NWM2372859
- 131 E Skyview Ct
- 621 E Hyland Dr
- 320 E 4th St
- 130 E Tacoma St
- 482 E Hyland Dr
- 5060 E State Route 106
- 211 E E Linda Vista Ct
- 1 Rd
- 231 E Linda Vista Ct
- 0 XXXX E Dalby Rd
- 0 Sprague Ave Unit NWM2432045
- 0 Sprague Ave Unit NWM2432096
- 40 E Paint Brush Ln
- 100 E Fir Tree Ln
- 121 E Fir Tree Ln
- 0 E Mason Ave
- 971 E Manzanita Dr
- 121 E Country Club Dr E
- 1250 E Vine Maple Ln
- 3771 E State Route 106
- 3781 E State Route 106
- 3741 E State Route 106
- 3731 E State Route 106
- 3765 Washington 106
- 3741 Washington 106
- 3721 E State Route 106
- 3690 E State Route 106
- 3780 E State Route 106
- 3692 E State Route 106
- 3830 E State Route 106
- 741 E Union Ridge Rd
- 0 Hwy 106 Unit 796364
- 0 Hwy 106 Unit 1077943
- 0 Hwy 106 Unit 1077952
- 0 Hwy 106 Unit NWM20076503
- 0 Hwy 106 Unit NWM30800391
- 0 Hwy 106 Unit NWM55107952
- 840 E Union Ridge Rd
- 3990 E State Route 106
Your Personal Tour Guide
Ask me questions while you tour the home.