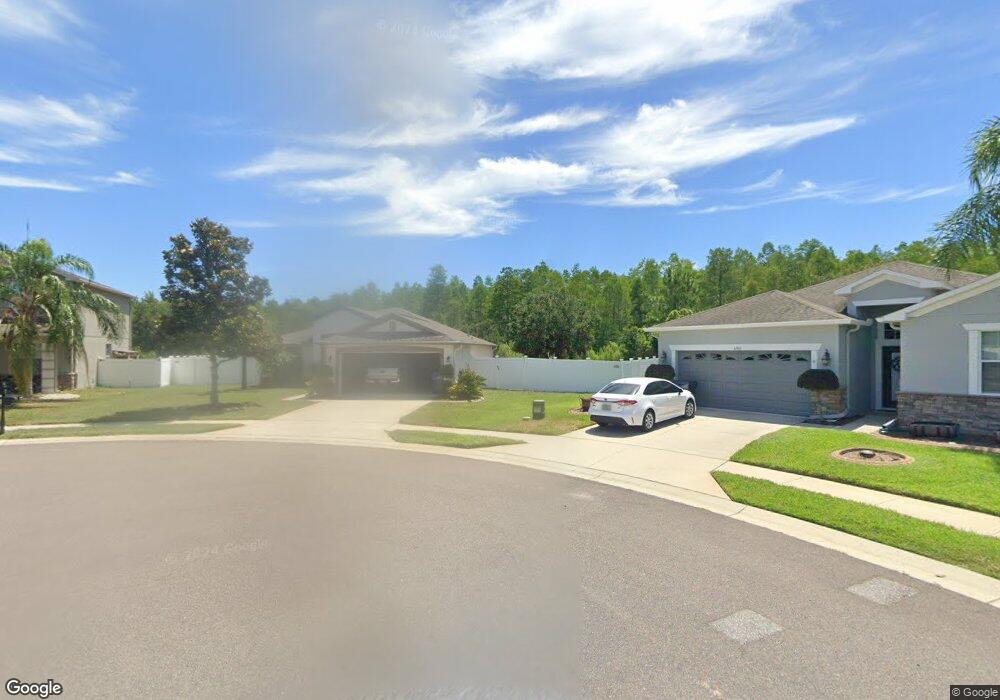
3761 Gerrads Cross Ct Land O Lakes, FL 34638
Concord Station NeighborhoodEstimated Value: $340,943 - $381,000
3
Beds
2
Baths
1,874
Sq Ft
$192/Sq Ft
Est. Value
About This Home
This home is located at 3761 Gerrads Cross Ct, Land O Lakes, FL 34638 and is currently estimated at $359,486, approximately $191 per square foot. 3761 Gerrads Cross Ct is a home located in Pasco County with nearby schools including Oakstead Elementary School, Charles S. Rushe Middle School, and Sunlake High School.
Ownership History
Date
Name
Owned For
Owner Type
Purchase Details
Closed on
May 15, 2024
Sold by
Weir James P
Bought by
Weir James P and Duran Taylor
Current Estimated Value
Purchase Details
Closed on
Mar 4, 2016
Sold by
Harp Tanner Z and Benter Selina
Bought by
Weir James P
Home Financials for this Owner
Home Financials are based on the most recent Mortgage that was taken out on this home.
Original Mortgage
$172,812
Interest Rate
3.81%
Mortgage Type
FHA
Purchase Details
Closed on
Apr 29, 2011
Sold by
Lennar Homes Llc
Bought by
Harp Tanner Z and Bengter Selina
Home Financials for this Owner
Home Financials are based on the most recent Mortgage that was taken out on this home.
Original Mortgage
$177,202
Interest Rate
4.79%
Mortgage Type
New Conventional
Create a Home Valuation Report for This Property
The Home Valuation Report is an in-depth analysis detailing your home's value as well as a comparison with similar homes in the area
Home Values in the Area
Average Home Value in this Area
Purchase History
| Date | Buyer | Sale Price | Title Company |
|---|---|---|---|
| Weir James P | -- | None Listed On Document | |
| Weir James P | $176,000 | Attorney | |
| Harp Tanner Z | $171,000 | North American Title Company | |
| Lennar Homes Llc | $171,000 | North American Title Company |
Source: Public Records
Mortgage History
| Date | Status | Borrower | Loan Amount |
|---|---|---|---|
| Previous Owner | Weir James P | $172,812 | |
| Previous Owner | Harp Tanner Z | $177,202 |
Source: Public Records
Tax History Compared to Growth
Tax History
| Year | Tax Paid | Tax Assessment Tax Assessment Total Assessment is a certain percentage of the fair market value that is determined by local assessors to be the total taxable value of land and additions on the property. | Land | Improvement |
|---|---|---|---|---|
| 2025 | $5,023 | $182,130 | -- | -- |
| 2024 | $5,023 | $177,000 | -- | -- |
| 2023 | $4,923 | $171,850 | $61,876 | $109,974 |
| 2022 | $4,546 | $166,850 | $0 | $0 |
| 2021 | $4,358 | $161,990 | $42,204 | $119,786 |
| 2020 | $4,320 | $159,760 | $34,078 | $125,682 |
| 2019 | $4,278 | $156,173 | $29,078 | $127,095 |
| 2018 | $4,348 | $160,219 | $0 | $0 |
| 2017 | $4,335 | $156,924 | $29,078 | $127,846 |
| 2016 | $3,855 | $128,827 | $0 | $0 |
| 2015 | $2,968 | $127,931 | $0 | $0 |
| 2014 | $2,920 | $140,355 | $29,078 | $111,277 |
Source: Public Records
Map
Nearby Homes
- 3723 Round Table Ct
- 3825 Buckinghamshire Dr
- 3328 Rennes Ct
- 3862 Tristram Loop
- 3809 Tristram Loop
- 19091 Umberland Place
- 3883 Tristram Loop
- 3255 Dunstable Dr
- 3355 Chessington Dr
- 18312 Snowdonia Dr
- 18281 Rossendale Ct
- 18419 Merseyside Loop
- 3115 Chessington Dr
- 19332 Everton Place
- 19351 Haskell Place
- 4136 Shrewbury Place
- 18084 Atherstone Trail
- 18055 Glastonbury Ln
- 3243 Ashmonte Dr
- 3322 Ashmonte Dr
- 3757 Gerrads Cross Ct
- 3765 Gerrads Cross Ct
- 3753 Gerrads Cross Ct
- 3764 Gerrads Cross Ct
- 3760 Gerrads Cross Ct
- 18756 Burndall Ct
- 18746 Burndall Ct
- 3756 Gerrads Cross Ct
- 18734 Burndall Ct
- 18762 Burndall Ct Unit G
- 3736 Gerrads Cross Ct
- 3720 Gerrads Cross Ct
- 18766 Burndall Ct
- 3558 Marmalade Ct
- 3710 Gerrads Cross Ct
- 18715 Burndall Ct
- 3560 Marmalade Ct
- 3556 Marmalade Ct
- 18745 Burndall Ct
- 18770 Burndall Ct