Estimated Value: $324,122 - $368,000
3
Beds
2
Baths
1,170
Sq Ft
$289/Sq Ft
Est. Value
About This Home
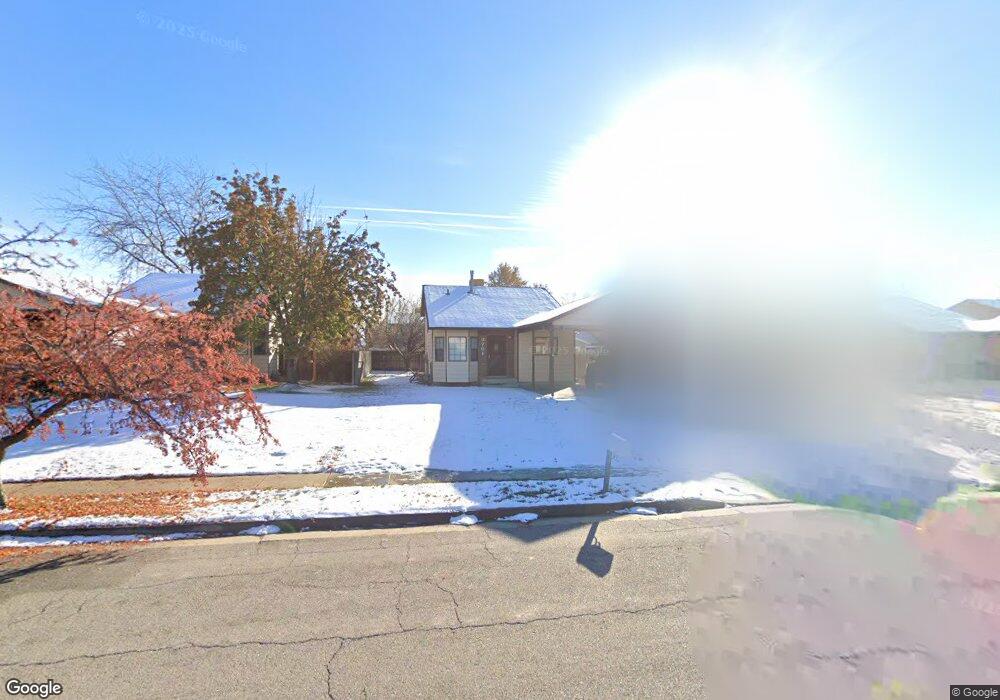
This home is located at 3761 W 4550 S, Roy, UT 84067 and is currently estimated at $338,531, approximately $289 per square foot. 3761 W 4550 S is a home located in Weber County with nearby schools including West Haven School, Sand Ridge Junior High School, and Roy High School.
Ownership History
Date
Name
Owned For
Owner Type
Purchase Details
Closed on
Apr 6, 2022
Sold by
Hall Keith Justin
Bought by
Brinkman Cheyenne Lynette and Brinkman Michael
Current Estimated Value
Home Financials for this Owner
Home Financials are based on the most recent Mortgage that was taken out on this home.
Original Mortgage
$324,022
Outstanding Balance
$303,182
Interest Rate
3.89%
Mortgage Type
FHA
Estimated Equity
$35,349
Purchase Details
Closed on
Jul 30, 2007
Sold by
Porter Casey B and Porter Tracy I
Bought by
Wallace Roy P
Home Financials for this Owner
Home Financials are based on the most recent Mortgage that was taken out on this home.
Original Mortgage
$126,514
Interest Rate
6.73%
Mortgage Type
FHA
Create a Home Valuation Report for This Property
The Home Valuation Report is an in-depth analysis detailing your home's value as well as a comparison with similar homes in the area
Home Values in the Area
Average Home Value in this Area
Purchase History
| Date | Buyer | Sale Price | Title Company |
|---|---|---|---|
| Brinkman Cheyenne Lynette | -- | None Listed On Document | |
| Wallace Roy P | -- | First American Riverdale |
Source: Public Records
Mortgage History
| Date | Status | Borrower | Loan Amount |
|---|---|---|---|
| Open | Brinkman Cheyenne Lynette | $324,022 | |
| Previous Owner | Wallace Roy P | $126,514 | |
| Closed | Brinkman Cheyenne Lynette | $11,550 |
Source: Public Records
Tax History
| Year | Tax Paid | Tax Assessment Tax Assessment Total Assessment is a certain percentage of the fair market value that is determined by local assessors to be the total taxable value of land and additions on the property. | Land | Improvement |
|---|---|---|---|---|
| 2025 | $1,664 | $294,750 | $100,010 | $194,740 |
| 2024 | $1,625 | $159,499 | $55,005 | $104,494 |
| 2023 | $1,561 | $153,450 | $49,371 | $104,079 |
| 2022 | $1,658 | $166,100 | $46,751 | $119,349 |
| 2021 | $1,366 | $227,000 | $59,982 | $167,018 |
| 2020 | $1,189 | $181,000 | $59,982 | $121,018 |
| 2019 | $1,169 | $168,000 | $34,993 | $133,007 |
| 2018 | $1,140 | $155,000 | $31,047 | $123,953 |
| 2017 | $984 | $126,000 | $31,047 | $94,953 |
| 2016 | $930 | $64,285 | $17,032 | $47,253 |
| 2015 | $884 | $63,036 | $17,032 | $46,004 |
| 2014 | $763 | $53,759 | $17,032 | $36,727 |
Source: Public Records
Map
Nearby Homes
- 3878 W 4700 S
- 3610 W 4475 S
- 4602 S 4000 W
- 4813 S 3850 W
- 3808 W 4300 S
- 4024 W 4650 S
- 4101 W 4600 S
- 3405 W 4525 S
- 3517 W 4835 S Unit 27
- 4491 Haven Creek Rd Unit A
- 3509 W 4835 S Unit 26
- 4322 S 3450 W
- 3511 W 4200 S
- 4435 Cross Creek Rd Unit 29C
- 4317 S 3350 W
- 4324 S 3350 W
- 4486 S 4300 W
- 4083 S 3475 W
- 4853 S 4275 W
- 4853 S 4275 W Unit 27
Your Personal Tour Guide
Ask me questions while you tour the home.