Estimated Value: $453,000 - $496,000
4
Beds
2
Baths
2,686
Sq Ft
$178/Sq Ft
Est. Value
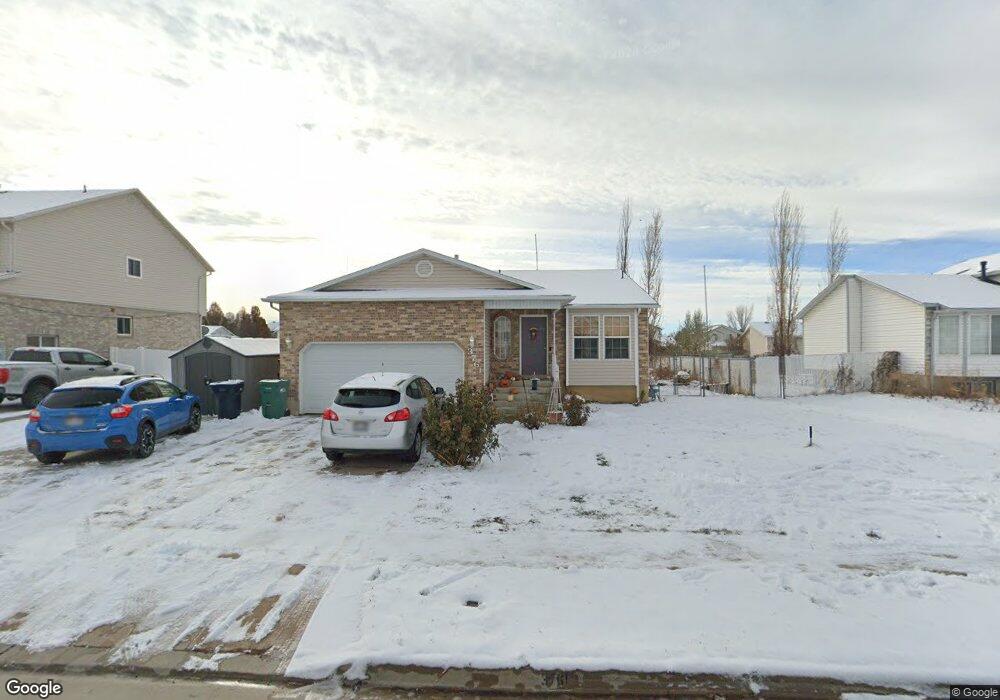
About This Home
This home is located at 3761 W 5625 S, Roy, UT 84067 and is currently estimated at $478,467, approximately $178 per square foot. 3761 W 5625 S is a home located in Weber County with nearby schools including Midland School, Roy Junior High School, and Roy High School.
Ownership History
Date
Name
Owned For
Owner Type
Purchase Details
Closed on
Dec 27, 2002
Sold by
Atl Technology Lg
Bought by
Hudman Gary D and Hudman Janae
Current Estimated Value
Home Financials for this Owner
Home Financials are based on the most recent Mortgage that was taken out on this home.
Original Mortgage
$119,900
Outstanding Balance
$50,554
Interest Rate
5.86%
Estimated Equity
$427,913
Purchase Details
Closed on
Aug 6, 2002
Sold by
Kunz Ryan A and Kunz Vicky L
Bought by
Atl Technology Lc
Purchase Details
Closed on
Apr 11, 1997
Sold by
Ongley Gary S and Ongley Gay H
Bought by
Shron Inc
Home Financials for this Owner
Home Financials are based on the most recent Mortgage that was taken out on this home.
Original Mortgage
$113,871
Interest Rate
7.85%
Mortgage Type
FHA
Purchase Details
Closed on
Feb 19, 1997
Sold by
Shron Inc
Bought by
Kunz Ryan A and Kunz Vicky L
Home Financials for this Owner
Home Financials are based on the most recent Mortgage that was taken out on this home.
Original Mortgage
$113,871
Interest Rate
7.85%
Mortgage Type
FHA
Create a Home Valuation Report for This Property
The Home Valuation Report is an in-depth analysis detailing your home's value as well as a comparison with similar homes in the area
Home Values in the Area
Average Home Value in this Area
Purchase History
| Date | Buyer | Sale Price | Title Company |
|---|---|---|---|
| Hudman Gary D | -- | -- | |
| Atl Technology Lc | -- | First American Title Co | |
| Shron Inc | -- | -- | |
| Kunz Ryan A | -- | -- |
Source: Public Records
Mortgage History
| Date | Status | Borrower | Loan Amount |
|---|---|---|---|
| Open | Hudman Gary D | $119,900 | |
| Previous Owner | Kunz Ryan A | $113,871 |
Source: Public Records
Tax History Compared to Growth
Tax History
| Year | Tax Paid | Tax Assessment Tax Assessment Total Assessment is a certain percentage of the fair market value that is determined by local assessors to be the total taxable value of land and additions on the property. | Land | Improvement |
|---|---|---|---|---|
| 2025 | $2,993 | $481,200 | $145,004 | $336,196 |
| 2024 | $2,921 | $260,149 | $79,752 | $180,397 |
| 2023 | $2,874 | $256,850 | $74,166 | $182,684 |
| 2022 | $2,716 | $248,050 | $60,501 | $187,549 |
| 2021 | $2,337 | $352,000 | $79,963 | $272,037 |
| 2020 | $2,192 | $303,000 | $79,963 | $223,037 |
| 2019 | $2,100 | $273,000 | $49,906 | $223,094 |
| 2018 | $2,010 | $246,000 | $46,982 | $199,018 |
| 2017 | $1,863 | $213,000 | $46,982 | $166,018 |
| 2016 | $1,796 | $110,400 | $23,077 | $87,323 |
| 2015 | $1,599 | $100,022 | $23,077 | $76,945 |
| 2014 | $1,536 | $94,609 | $23,077 | $71,532 |
Source: Public Records
Map
Nearby Homes