Estimated Value: $440,862 - $469,000
3
Beds
2
Baths
1,304
Sq Ft
$347/Sq Ft
Est. Value
About This Home
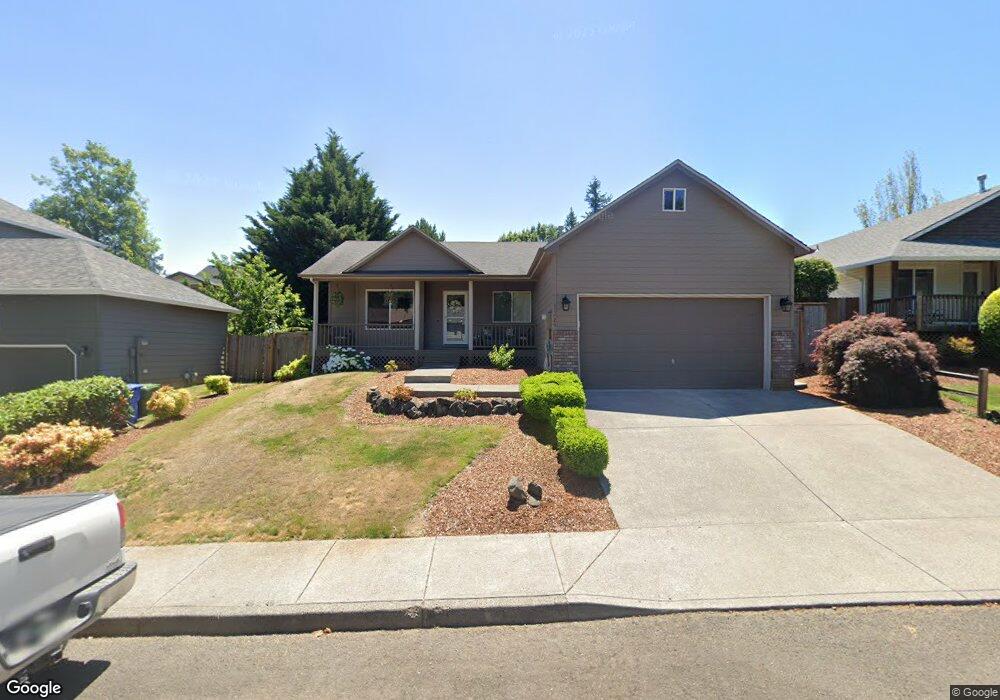
This home is located at 37626 Emerald Cascade St, Sandy, OR 97055 and is currently estimated at $452,466, approximately $346 per square foot. 37626 Emerald Cascade St is a home located in Clackamas County with nearby schools including Kelso Elementary School, Boring Middle School, and Sandy High School.
Ownership History
Date
Name
Owned For
Owner Type
Purchase Details
Closed on
Feb 8, 2011
Sold by
Rivermark Community Credit Union
Bought by
Schlaht Dawn N
Current Estimated Value
Home Financials for this Owner
Home Financials are based on the most recent Mortgage that was taken out on this home.
Original Mortgage
$176,165
Outstanding Balance
$120,161
Interest Rate
4.79%
Mortgage Type
New Conventional
Estimated Equity
$332,305
Purchase Details
Closed on
Oct 24, 2007
Sold by
Mcdermott Michael F
Bought by
Rivermark Community Cu
Purchase Details
Closed on
Aug 28, 2002
Sold by
Ed Dix Construction Inc
Bought by
Mcdermott Michael F
Home Financials for this Owner
Home Financials are based on the most recent Mortgage that was taken out on this home.
Original Mortgage
$156,543
Interest Rate
6.43%
Mortgage Type
FHA
Purchase Details
Closed on
Feb 23, 1999
Sold by
4-J Land Co Llc
Bought by
Ed Dix Construction Inc
Create a Home Valuation Report for This Property
The Home Valuation Report is an in-depth analysis detailing your home's value as well as a comparison with similar homes in the area
Home Values in the Area
Average Home Value in this Area
Purchase History
| Date | Buyer | Sale Price | Title Company |
|---|---|---|---|
| Schlaht Dawn N | $170,000 | Chicago Title Company Oregon | |
| Rivermark Community Cu | $189,478 | Fidelity National Title Co | |
| Mcdermott Michael F | $159,000 | First American Title Ins Co | |
| Ed Dix Construction Inc | $49,900 | First American Title Ins Co |
Source: Public Records
Mortgage History
| Date | Status | Borrower | Loan Amount |
|---|---|---|---|
| Open | Schlaht Dawn N | $176,165 | |
| Previous Owner | Mcdermott Michael F | $156,543 |
Source: Public Records
Tax History
| Year | Tax Paid | Tax Assessment Tax Assessment Total Assessment is a certain percentage of the fair market value that is determined by local assessors to be the total taxable value of land and additions on the property. | Land | Improvement |
|---|---|---|---|---|
| 2025 | $3,937 | $229,459 | -- | -- |
| 2024 | $3,771 | $222,776 | -- | -- |
| 2023 | $3,771 | $216,288 | $0 | $0 |
| 2022 | $3,572 | $209,989 | $0 | $0 |
| 2021 | $3,449 | $203,873 | $0 | $0 |
| 2020 | $3,356 | $197,935 | $0 | $0 |
| 2019 | $3,324 | $192,170 | $0 | $0 |
| 2018 | $3,231 | $186,573 | $0 | $0 |
| 2017 | $3,152 | $181,139 | $0 | $0 |
| 2016 | $3,044 | $175,863 | $0 | $0 |
Source: Public Records
Map
Nearby Homes
- 37480 Coralburst St
- 15902 Dreamcatcher Ave
- 37802 SE Olson St
- 15572 Bachelor Ave
- 0 SE Jewelberry Ave Unit 648659733
- 16370 Bell St
- 16370 Bell St Unit 2
- 15520 Rainier Ave
- 38029 SE Marcella Ct
- 36713 Indian Summer St
- 37867 College St
- 16994 University Ave
- 38376 Hood St
- 36745 Eldridge Dr
- 38091 Sunset St
- 37600 Sunset St Unit 26
- 38565 Pleasant St
- 17655 Bluff Rd Unit 73
- 17655 Bluff Rd Unit 42
- 17647 Hardenbrook Ave
- 37584 Emerald Cascade St
- 37648 Emerald Cascade St
- 37615 Coralburst St
- 37595 Coralburst St
- 37637 Coralburst St
- 37562 Emerald Cascade St
- 37573 Coralburst St
- 37617 Emerald Cascade St Unit 1
- 37617 Emerald Cascade St
- 37575 Emerald Cascade St
- 37639 Emerald Cascade St
- 37551 Coralburst St
- 37540 Emerald Cascade St
- 37553 Emerald Cascade St
- 37679 Coralburst St
- 15893 Jade Glen Ave
- 15879 Jade Glen Ave
- 37539 Coralburst St
- 15837 Jade Glen Ave
- 37531 Emerald Cascade St
Your Personal Tour Guide
Ask me questions while you tour the home.