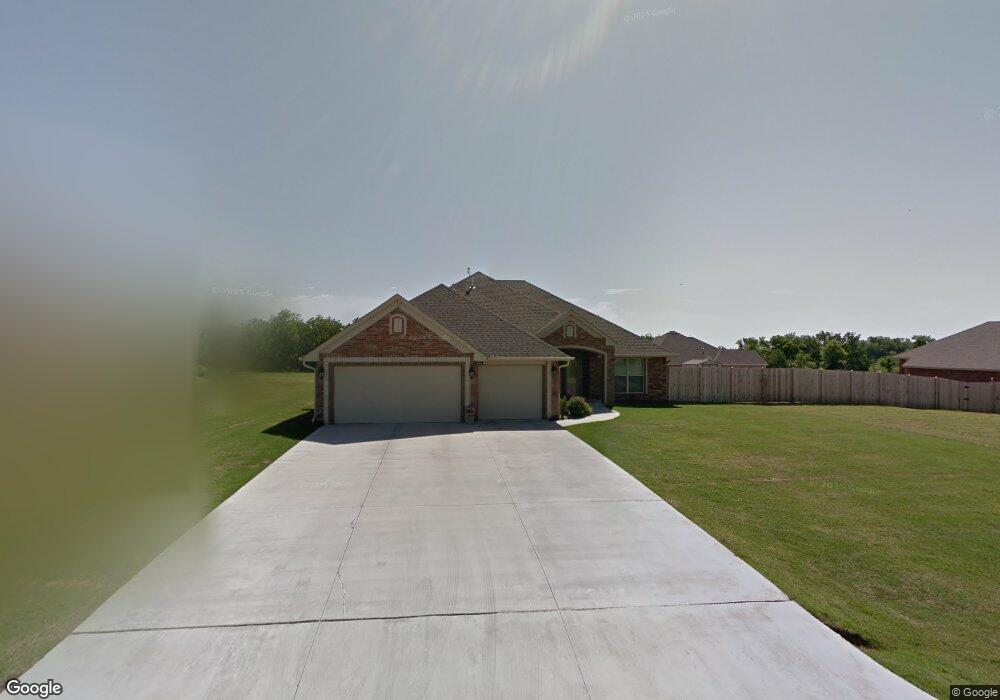
3764 Guinn Ave Norman, OK 73072
Estimated Value: $366,085 - $376,000
3
Beds
3
Baths
2,114
Sq Ft
$176/Sq Ft
Est. Value
About This Home
This home is located at 3764 Guinn Ave, Norman, OK 73072 and is currently estimated at $372,771, approximately $176 per square foot. 3764 Guinn Ave is a home with nearby schools including Newcastle Elementary School, Newcastle Middle School, and Newcastle High School.
Ownership History
Date
Name
Owned For
Owner Type
Purchase Details
Closed on
Dec 20, 2010
Sold by
Da Vinci Enterprises Inc
Bought by
Ketchum Steven F and Ketchum Diana L
Current Estimated Value
Home Financials for this Owner
Home Financials are based on the most recent Mortgage that was taken out on this home.
Original Mortgage
$155,000
Outstanding Balance
$2,309
Interest Rate
4.18%
Mortgage Type
New Conventional
Estimated Equity
$370,462
Purchase Details
Closed on
Jun 30, 2009
Sold by
Newcastle Education Foundation
Bought by
Davinci Enterprises Inc
Home Financials for this Owner
Home Financials are based on the most recent Mortgage that was taken out on this home.
Original Mortgage
$174,490
Interest Rate
5.39%
Mortgage Type
Purchase Money Mortgage
Purchase Details
Closed on
Sep 9, 2008
Sold by
Remington Development Llc
Bought by
Newcastle Education Foundation
Create a Home Valuation Report for This Property
The Home Valuation Report is an in-depth analysis detailing your home's value as well as a comparison with similar homes in the area
Home Values in the Area
Average Home Value in this Area
Purchase History
| Date | Buyer | Sale Price | Title Company |
|---|---|---|---|
| Ketchum Steven F | $200,000 | Gaco | |
| Davinci Enterprises Inc | $27,500 | None Available | |
| Newcastle Education Foundation | -- | None Available |
Source: Public Records
Mortgage History
| Date | Status | Borrower | Loan Amount |
|---|---|---|---|
| Open | Ketchum Steven F | $155,000 | |
| Previous Owner | Davinci Enterprises Inc | $174,490 |
Source: Public Records
Tax History Compared to Growth
Tax History
| Year | Tax Paid | Tax Assessment Tax Assessment Total Assessment is a certain percentage of the fair market value that is determined by local assessors to be the total taxable value of land and additions on the property. | Land | Improvement |
|---|---|---|---|---|
| 2025 | $3,283 | $30,529 | $3,911 | $26,618 |
| 2024 | $3,283 | $29,639 | $3,797 | $25,842 |
| 2023 | $3,283 | $28,777 | $3,719 | $25,058 |
| 2022 | $3,109 | $27,938 | $3,630 | $24,308 |
| 2021 | $3,255 | $27,870 | $3,625 | $24,245 |
| 2020 | $3,170 | $27,059 | $3,569 | $23,490 |
| 2019 | $3,120 | $26,271 | $3,514 | $22,757 |
| 2018 | $2,980 | $25,506 | $3,588 | $21,918 |
| 2017 | $2,884 | $24,763 | $3,249 | $21,514 |
| 2016 | $2,807 | $24,042 | $3,279 | $20,763 |
| 2015 | $2,723 | $23,341 | $2,864 | $20,477 |
| 2014 | $2,606 | $22,662 | $2,797 | $19,865 |
Source: Public Records
Map
Nearby Homes
- 3754 Kilby Ave
- 4000 Blue Ridge Ave
- 4001 Blue Ridge Ave
- 4000 Black Rock Ln
- 4027 Blue Ridge Ave
- 4046 Black Rock Ln
- 4027 Black Rock Ln
- 4001 Great Redwood Rd
- 4025 S Penn Ave
- 4025 Great Redwood Rd
- 4076 Blue Ridge Ave
- 4083 Great Redwood Rd
- 4045 Great Redwood Rd
- 4144 Blue Ridge Ave
- 4084 Blue Ridge Ave
- 4100 Blue Ridge Ave
- 4110 Blue Ridge Ave
- 4120 Blue Ridge Ave
- 4132 Blue Ridge Ave
- 2836 SE 42nd St
- 3742 Guinn Ave
- 3786 Guinn Ave
- 3093 SE 38th St
- 3751 Guinn Ave
- 3720 Guinn Ave
- 3062 SE 37th St
- 3119 SE 38th St
- 3735 Guinn Ave
- 3828 Guinn Ave
- 3080 SE 37th St
- 3799 Guinn Ave
- 2030 SE 38th St
- 3713 Guinn Ave
- 3821 Guinn Ave
- 3137 SE 38th St
- 3057 SE 37th St
- 3687 Guinn Ave
- 3118 SE 37th St
- 3842 Guinn Ave
- 2021 SE 38th St