Estimated Value: $451,000 - $475,000
4
Beds
3
Baths
1,847
Sq Ft
$248/Sq Ft
Est. Value
About This Home
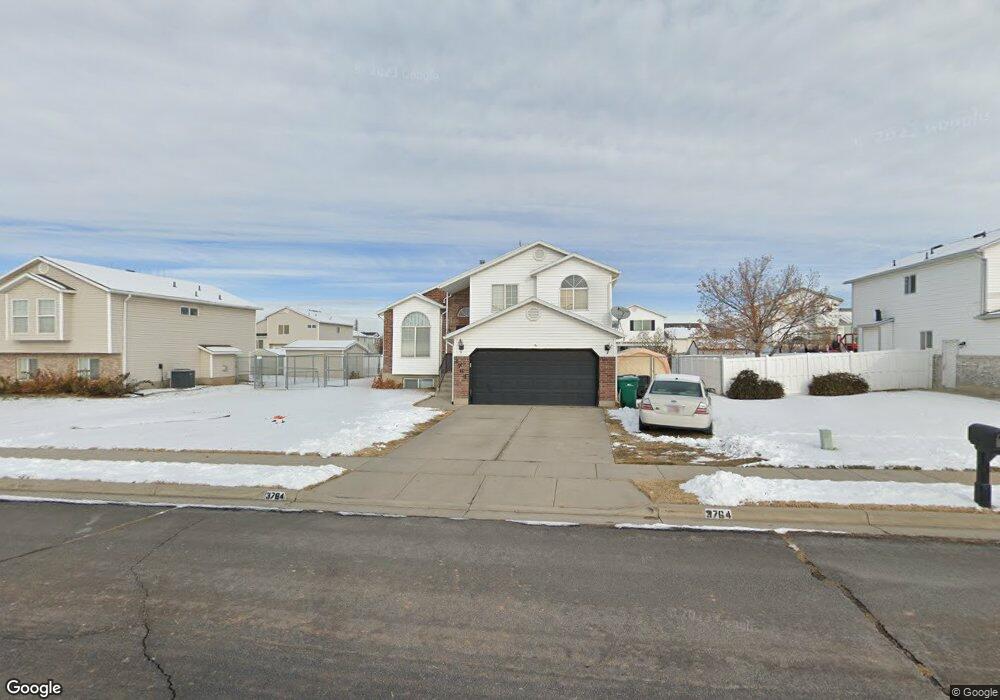
This home is located at 3764 W 5625 S, Roy, UT 84067 and is currently estimated at $458,724, approximately $248 per square foot. 3764 W 5625 S is a home located in Weber County with nearby schools including Midland School, Roy Junior High School, and Roy High School.
Ownership History
Date
Name
Owned For
Owner Type
Purchase Details
Closed on
Jan 14, 2021
Sold by
Rigby Steven M and Rigby Tiera H
Bought by
Rigby Tiera Harrison and Rigby Steven Michael
Current Estimated Value
Home Financials for this Owner
Home Financials are based on the most recent Mortgage that was taken out on this home.
Original Mortgage
$103,750
Outstanding Balance
$92,597
Interest Rate
2.71%
Mortgage Type
New Conventional
Estimated Equity
$366,127
Purchase Details
Closed on
Feb 17, 2006
Sold by
Allen Gregory R and Allen Heather K
Bought by
Rigby Steven M and Rigby Tiera H
Home Financials for this Owner
Home Financials are based on the most recent Mortgage that was taken out on this home.
Original Mortgage
$158,020
Interest Rate
6.15%
Mortgage Type
FHA
Purchase Details
Closed on
Nov 1, 1997
Sold by
Shron Inc
Bought by
Allen Gregory R and Allen Heather K
Home Financials for this Owner
Home Financials are based on the most recent Mortgage that was taken out on this home.
Original Mortgage
$116,002
Interest Rate
7.3%
Mortgage Type
FHA
Create a Home Valuation Report for This Property
The Home Valuation Report is an in-depth analysis detailing your home's value as well as a comparison with similar homes in the area
Home Values in the Area
Average Home Value in this Area
Purchase History
| Date | Buyer | Sale Price | Title Company |
|---|---|---|---|
| Rigby Tiera Harrison | -- | Infinity Title Ins Agcy Llc | |
| Rigby Steven M | -- | Backman Title Services Ltd | |
| Allen Gregory R | -- | -- |
Source: Public Records
Mortgage History
| Date | Status | Borrower | Loan Amount |
|---|---|---|---|
| Open | Rigby Tiera Harrison | $103,750 | |
| Closed | Rigby Steven M | $158,020 | |
| Previous Owner | Allen Gregory R | $116,002 |
Source: Public Records
Tax History Compared to Growth
Tax History
| Year | Tax Paid | Tax Assessment Tax Assessment Total Assessment is a certain percentage of the fair market value that is determined by local assessors to be the total taxable value of land and additions on the property. | Land | Improvement |
|---|---|---|---|---|
| 2025 | $2,697 | $428,925 | $145,004 | $283,921 |
| 2024 | $2,634 | $422,000 | $145,004 | $276,996 |
| 2023 | $2,638 | $425,000 | $134,847 | $290,153 |
| 2022 | $2,456 | $404,000 | $110,001 | $293,999 |
| 2021 | $2,119 | $316,000 | $79,963 | $236,037 |
| 2020 | $1,974 | $270,000 | $79,963 | $190,037 |
| 2019 | $1,960 | $253,000 | $49,906 | $203,094 |
| 2018 | $1,803 | $218,000 | $46,982 | $171,018 |
| 2017 | $1,674 | $189,000 | $46,982 | $142,018 |
| 2016 | $1,624 | $98,612 | $23,077 | $75,535 |
| 2015 | $1,439 | $88,738 | $23,077 | $65,661 |
| 2014 | $1,364 | $82,576 | $23,077 | $59,499 |
Source: Public Records
Map
Nearby Homes