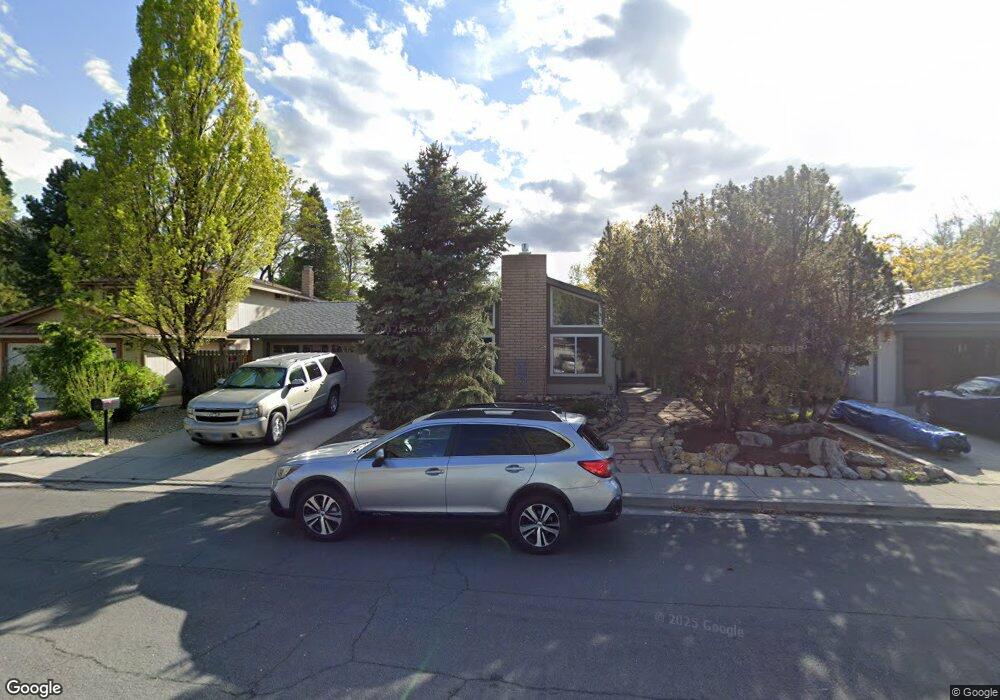
3765 Vantage Way Reno, NV 89502
Hidden Valley NeighborhoodEstimated Value: $479,000 - $535,000
4
Beds
2
Baths
1,910
Sq Ft
$262/Sq Ft
Est. Value
About This Home
This home is located at 3765 Vantage Way, Reno, NV 89502 and is currently estimated at $500,980, approximately $262 per square foot. 3765 Vantage Way is a home located in Washoe County with nearby schools including Edwin S. Dodson Elementary School, Edward L Pine Middle School, and Earl Wooster High School.
Ownership History
Date
Name
Owned For
Owner Type
Purchase Details
Closed on
Jul 22, 1999
Sold by
Cook Harold George
Bought by
Squire David R and Wadelski Louise E
Current Estimated Value
Home Financials for this Owner
Home Financials are based on the most recent Mortgage that was taken out on this home.
Original Mortgage
$119,200
Interest Rate
7.51%
Purchase Details
Closed on
Apr 6, 1998
Sold by
Cook Harold George
Bought by
Cook Harold George
Home Financials for this Owner
Home Financials are based on the most recent Mortgage that was taken out on this home.
Original Mortgage
$15,000
Interest Rate
7.07%
Purchase Details
Closed on
Apr 21, 1997
Sold by
Steinshouer Douglas P and Auckenthaler Lori A
Bought by
Cook Harold George
Home Financials for this Owner
Home Financials are based on the most recent Mortgage that was taken out on this home.
Original Mortgage
$98,000
Interest Rate
7.86%
Create a Home Valuation Report for This Property
The Home Valuation Report is an in-depth analysis detailing your home's value as well as a comparison with similar homes in the area
Home Values in the Area
Average Home Value in this Area
Purchase History
| Date | Buyer | Sale Price | Title Company |
|---|---|---|---|
| Squire David R | $149,000 | First Centennial Title Co | |
| Cook Harold George | -- | United Title | |
| Cook Harold George | $146,500 | Western Title Company Inc |
Source: Public Records
Mortgage History
| Date | Status | Borrower | Loan Amount |
|---|---|---|---|
| Previous Owner | Squire David R | $119,200 | |
| Previous Owner | Cook Harold George | $15,000 | |
| Previous Owner | Cook Harold George | $98,000 |
Source: Public Records
Tax History Compared to Growth
Tax History
| Year | Tax Paid | Tax Assessment Tax Assessment Total Assessment is a certain percentage of the fair market value that is determined by local assessors to be the total taxable value of land and additions on the property. | Land | Improvement |
|---|---|---|---|---|
| 2025 | $1,727 | $65,016 | $37,135 | $27,881 |
| 2024 | $1,727 | $61,642 | $32,550 | $29,092 |
| 2023 | $1,161 | $62,709 | $34,230 | $28,479 |
| 2022 | $1,554 | $52,894 | $28,420 | $24,474 |
| 2021 | $1,512 | $45,698 | $20,650 | $25,048 |
| 2020 | $1,462 | $46,412 | $20,650 | $25,762 |
| 2019 | $1,420 | $46,497 | $20,965 | $25,532 |
| 2018 | $1,379 | $40,321 | $14,805 | $25,516 |
| 2017 | $1,339 | $39,964 | $13,860 | $26,104 |
| 2016 | $1,305 | $38,485 | $11,340 | $27,145 |
| 2015 | $1,303 | $37,938 | $10,115 | $27,823 |
| 2014 | $1,266 | $36,131 | $8,890 | $27,241 |
| 2013 | -- | $33,456 | $6,300 | $27,156 |
Source: Public Records
Map
Nearby Homes
- 56 Lucky Ln
- 4071 Snowshoe Ln
- 4066 Snowshoe Ln
- 4318 Leeward Ln
- 65 Lucky Ln
- 4550 Noche Ln
- 4120 Vivian Ct
- 320 Lucky Ln
- 4491 Creekside Cir
- 4400 Alexander Lake Rd
- 4160 Mira Loma Dr Unit 2B
- 4405 Mesa Grande Ct
- 3095 Randolph Dr
- 3170 Santa Ana Dr
- 4550 Rio Poco Rd
- 4577 Reggie Rd Unit 22
- 4580 Matich Dr Unit 92
- 4593 Reggie Rd
- 4405 Primavera Ave
- 4604 Rio Poco Rd
- 3755 Vantage Way
- 3760 Amador Way
- 3750 Amador Way
- 3785 Vantage Way
- 3745 Vantage Way
- 3775 Vantage Way
- 3780 Amador Way
- 3766 Vantage Way
- 3770 Vantage Way
- 3756 Vantage Way
- 3740 Amador Way
- 3725 Vantage Way
- 3795 Vantage Way
- 3790 Vantage Way
- 3750 Vantage Way
- 3800 Amador Way
- 4255 Settler Dr
- 3761 La Tierra Terrace
- 3760 Wagoneer Dr
- 3815 Vantage Way