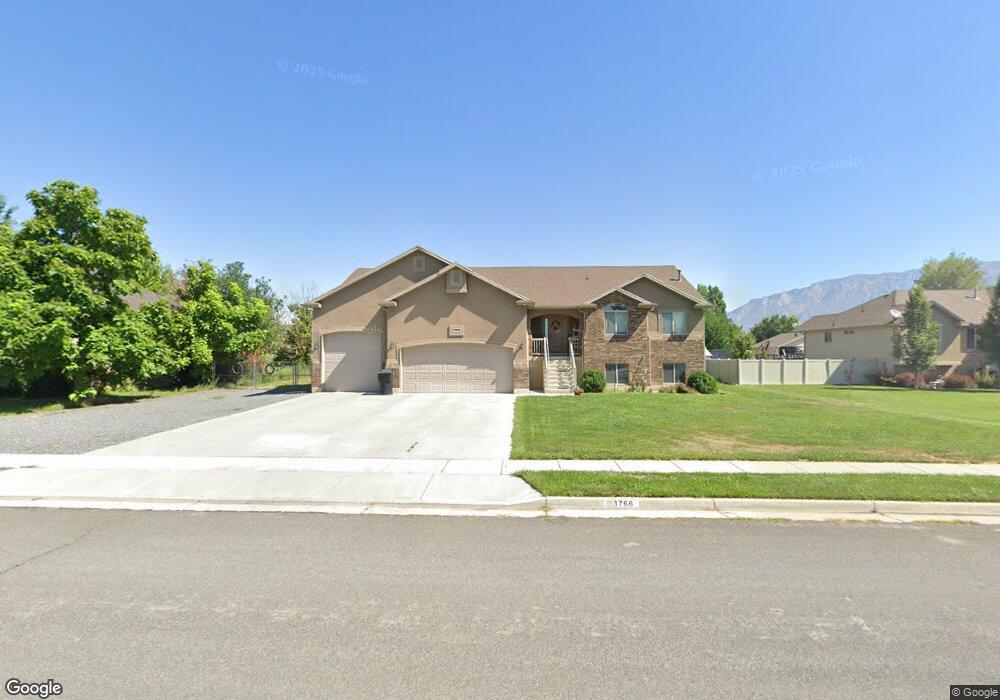
3766 W 2100 N Plain City, UT 84404
Estimated Value: $622,000 - $710,408
3
Beds
3
Baths
1,529
Sq Ft
$427/Sq Ft
Est. Value
About This Home
This home is located at 3766 W 2100 N, Plain City, UT 84404 and is currently estimated at $653,102, approximately $427 per square foot. 3766 W 2100 N is a home located in Weber County with nearby schools including Plain City School, Wahlquist Junior High School, and Fremont High School.
Ownership History
Date
Name
Owned For
Owner Type
Purchase Details
Closed on
Aug 12, 2011
Sold by
Meyerhoffer Justin L and Meyerhoffer Jodee L
Bought by
Smith Jason W and Smith Adrian R
Current Estimated Value
Home Financials for this Owner
Home Financials are based on the most recent Mortgage that was taken out on this home.
Original Mortgage
$272,234
Outstanding Balance
$227,934
Interest Rate
10%
Mortgage Type
Purchase Money Mortgage
Estimated Equity
$425,168
Purchase Details
Closed on
Nov 20, 2007
Sold by
Tri City Development Llc
Bought by
Meyerhoffer Justin L and Meyerhoffer Jodee L
Home Financials for this Owner
Home Financials are based on the most recent Mortgage that was taken out on this home.
Original Mortgage
$85,500
Interest Rate
6.38%
Mortgage Type
Purchase Money Mortgage
Create a Home Valuation Report for This Property
The Home Valuation Report is an in-depth analysis detailing your home's value as well as a comparison with similar homes in the area
Home Values in the Area
Average Home Value in this Area
Purchase History
| Date | Buyer | Sale Price | Title Company |
|---|---|---|---|
| Smith Jason W | -- | Bonneville Superior Title Co | |
| Meyerhoffer Justin L | -- | Mountain View Title Ogden |
Source: Public Records
Mortgage History
| Date | Status | Borrower | Loan Amount |
|---|---|---|---|
| Open | Smith Jason W | $272,234 | |
| Previous Owner | Meyerhoffer Justin L | $85,500 |
Source: Public Records
Tax History Compared to Growth
Tax History
| Year | Tax Paid | Tax Assessment Tax Assessment Total Assessment is a certain percentage of the fair market value that is determined by local assessors to be the total taxable value of land and additions on the property. | Land | Improvement |
|---|---|---|---|---|
| 2025 | $3,762 | $669,354 | $204,508 | $464,846 |
| 2024 | $3,986 | $361,899 | $112,470 | $249,429 |
| 2023 | $3,834 | $349,800 | $112,334 | $237,466 |
| 2022 | $4,035 | $386,651 | $100,733 | $285,918 |
| 2021 | $3,283 | $509,000 | $107,428 | $401,572 |
| 2020 | $3,150 | $448,000 | $96,983 | $351,017 |
| 2019 | $3,047 | $406,000 | $71,769 | $334,231 |
| 2018 | $3,084 | $396,000 | $71,769 | $324,231 |
| 2017 | $2,691 | $316,000 | $69,874 | $246,126 |
| 2016 | $2,618 | $167,750 | $36,993 | $130,757 |
| 2015 | $2,634 | $177,794 | $36,993 | $140,801 |
| 2014 | $2,512 | $153,884 | $31,448 | $122,436 |
Source: Public Records
Map
Nearby Homes
- 3622 W 2200 St N Unit 23
- 3966 W 2200 N
- 3594 W 2200 N Unit 3
- 4212 W 1975 N
- 2233 N 3600 St W Unit 22
- 2255 N 3600 St W Unit 21
- 4210 W 1975 N
- 3462 W 2565 N
- 1748 N 4100 St W
- 2416 N 4275 W
- 2741 N 3475 W
- 3963 2800 North St
- 2700 N 4200 W
- Newport Plan at Diamond E
- 2771 N 3225 W Unit 204
- 2788 N 3225 W Unit 206
- 2761 N 3225 W Unit 203
- 4227 W Pioneer Rd
- 2768 N 3225 W Unit 208
- 2793 W 2775 N