3768 Saddlemaker Dr Unit 6 Buford, GA 30519
Estimated Value: $588,000 - $632,000
5
Beds
4
Baths
3,388
Sq Ft
$180/Sq Ft
Est. Value
About This Home
This home is located at 3768 Saddlemaker Dr Unit 6, Buford, GA 30519 and is currently estimated at $608,798, approximately $179 per square foot. 3768 Saddlemaker Dr Unit 6 is a home located in Gwinnett County with nearby schools including Ivy Creek Elementary School and Glenn C. Jones Middle School.
Ownership History
Date
Name
Owned For
Owner Type
Purchase Details
Closed on
Mar 29, 2018
Sold by
Rcm Fund 1 Owner Llc
Bought by
Won Kwang G and Won Kyung Ok
Current Estimated Value
Home Financials for this Owner
Home Financials are based on the most recent Mortgage that was taken out on this home.
Original Mortgage
$200,000
Outstanding Balance
$171,215
Interest Rate
4.43%
Mortgage Type
New Conventional
Estimated Equity
$437,583
Purchase Details
Closed on
Jun 6, 2017
Sold by
Johnson Jerry O
Bought by
Rcm Fund 1 Owner Llc
Purchase Details
Closed on
Oct 25, 2012
Sold by
Premier Homebuilders Inc
Bought by
Johnson Jerry D
Home Financials for this Owner
Home Financials are based on the most recent Mortgage that was taken out on this home.
Original Mortgage
$263,857
Interest Rate
3.42%
Mortgage Type
VA
Purchase Details
Closed on
Mar 9, 2012
Sold by
Two Willows Development Gr
Bought by
Premier Homebuilders Inc
Create a Home Valuation Report for This Property
The Home Valuation Report is an in-depth analysis detailing your home's value as well as a comparison with similar homes in the area
Home Values in the Area
Average Home Value in this Area
Purchase History
| Date | Buyer | Sale Price | Title Company |
|---|---|---|---|
| Won Kwang G | $350,000 | -- | |
| Rcm Fund 1 Owner Llc | $261,000 | -- | |
| Johnson Jerry D | $263,857 | -- | |
| Premier Homebuilders Inc | $427,500 | -- |
Source: Public Records
Mortgage History
| Date | Status | Borrower | Loan Amount |
|---|---|---|---|
| Open | Won Kwang G | $200,000 | |
| Previous Owner | Johnson Jerry D | $263,857 |
Source: Public Records
Tax History
| Year | Tax Paid | Tax Assessment Tax Assessment Total Assessment is a certain percentage of the fair market value that is determined by local assessors to be the total taxable value of land and additions on the property. | Land | Improvement |
|---|---|---|---|---|
| 2025 | $1,709 | $277,840 | $32,800 | $245,040 |
| 2024 | $1,702 | $270,960 | $41,200 | $229,760 |
| 2023 | $1,702 | $270,960 | $41,200 | $229,760 |
| 2022 | $5,745 | $205,600 | $36,400 | $169,200 |
| 2021 | $4,464 | $140,000 | $24,000 | $116,000 |
| 2020 | $4,041 | $140,000 | $24,000 | $116,000 |
| 2019 | $4,498 | $140,000 | $24,000 | $116,000 |
| 2018 | $3,920 | $104,400 | $24,000 | $80,400 |
| 2016 | $1,828 | $126,200 | $19,600 | $106,600 |
| 2015 | $1,600 | $109,680 | $18,800 | $90,880 |
| 2014 | -- | $104,000 | $18,800 | $85,200 |
Source: Public Records
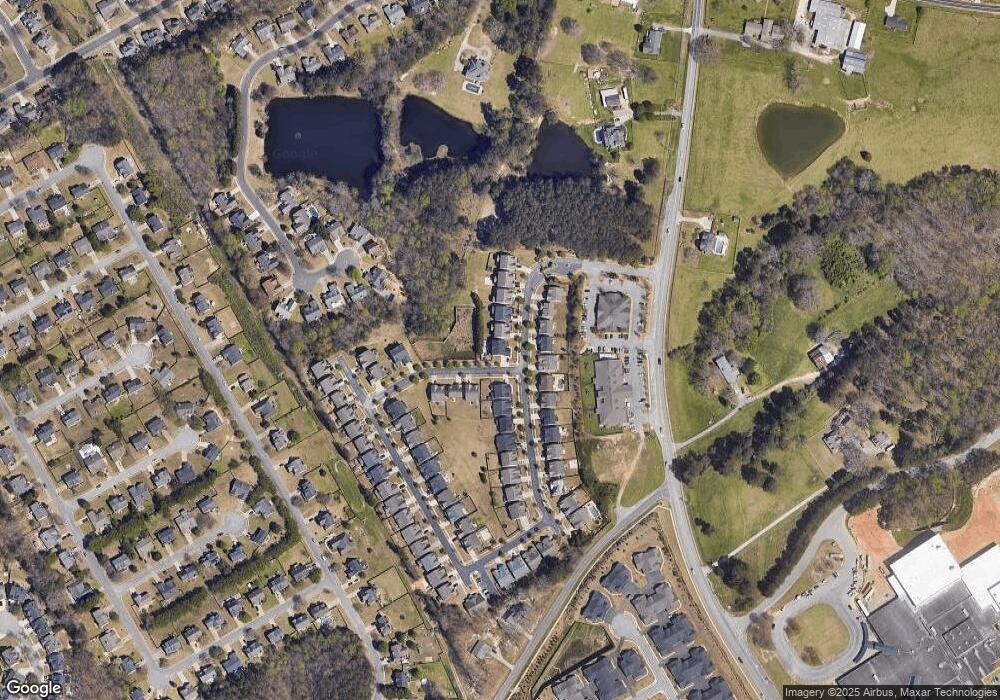
Map
Nearby Homes
- 3680 Ridge Rd
- 4165 Bradford Walk Trail
- 3510 Rivers End Place
- 3675 Ridgehurst Ln
- 2335 Morgan Place Dr
- 3075 Andover Trail
- 3421 Lindenridge Dr
- 3411 Lindenridge Dr
- 3713 Golden Ive Dr
- 4024 Dantry Ln
- 4044 Dantry Ln
- 3311 Burkston Place
- 4034 Dantry Ln
- 3125 Bart Johnson Rd
- 3391 Burkston Place
- 3629 Elinburg Ct
- 3721 Bogan Mill Rd
- 3561 Bogan Mill Rd
- 3570 Bogan Mill Rd NE
- 4001 Sovereign Dr
- 3768 Saddlemaker Dr
- 3778 Saddlemaker Dr
- 3788 Saddlemaker Dr
- 3748 Saddlemaker Dr
- 3769 Saddlemaker Dr
- 3759 Saddlemaker Dr
- 3798 Saddlemaker Dr
- 3738 Saddlemaker Dr
- 3495 Stackhouse Place
- 3495 Stackhouse Place Unit 44
- 3779 Saddlemaker Dr
- 3485 Stackhouse Place
- 3749 Saddlemaker Dr
- 3789 Saddlemaker Dr
- 3808 Saddlemaker Dr
- 3475 Stackhouse Place
- 3728 Saddlemaker Dr
- 3739 Saddlemaker Dr
- 3799 Saddlemaker Dr
- 3729 Saddlemaker Dr
Your Personal Tour Guide
Ask me questions while you tour the home.