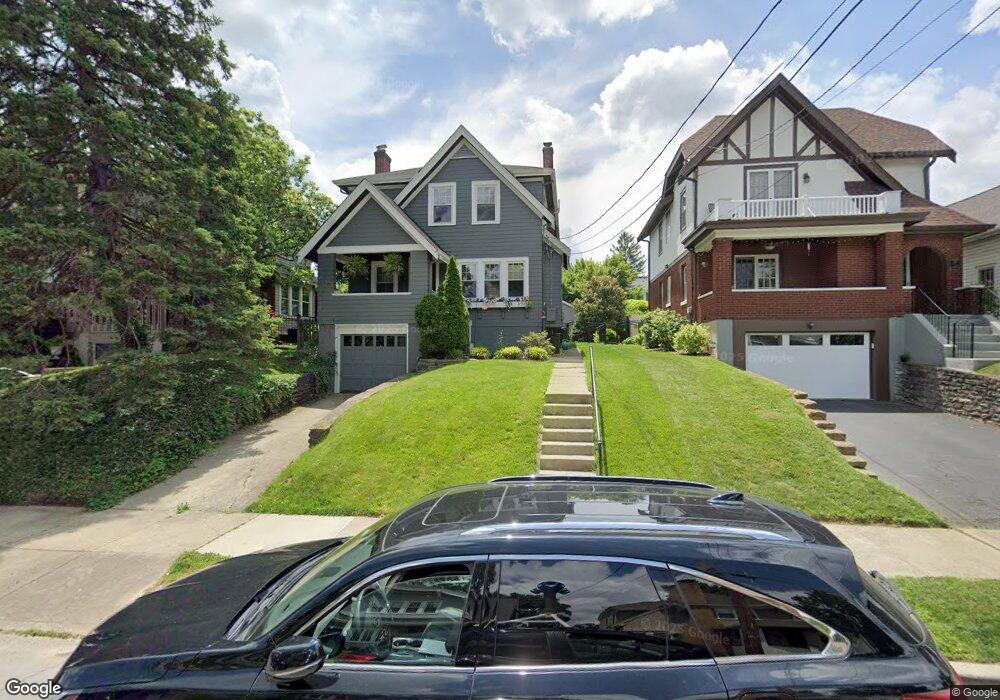
3769 Aylesboro Ave Cincinnati, OH 45208
Hyde Park NeighborhoodEstimated Value: $501,000 - $578,765
3
Beds
2
Baths
1,172
Sq Ft
$471/Sq Ft
Est. Value
About This Home
This home is located at 3769 Aylesboro Ave, Cincinnati, OH 45208 and is currently estimated at $551,691, approximately $470 per square foot. 3769 Aylesboro Ave is a home located in Hamilton County with nearby schools including Kilgour Elementary School, Clark Montessori High School, and Shroder High School.
Ownership History
Date
Name
Owned For
Owner Type
Purchase Details
Closed on
Apr 28, 2011
Sold by
Kessler Corey L and Kessler Tara C
Bought by
Campbell Eric P and Althof Nicole D
Current Estimated Value
Home Financials for this Owner
Home Financials are based on the most recent Mortgage that was taken out on this home.
Original Mortgage
$175,000
Outstanding Balance
$121,505
Interest Rate
4.86%
Mortgage Type
New Conventional
Estimated Equity
$430,186
Purchase Details
Closed on
Apr 13, 2004
Sold by
Falcone Richard A and Falcone Alexandra E
Bought by
Sinclair Tara C and Kessler Corey L
Home Financials for this Owner
Home Financials are based on the most recent Mortgage that was taken out on this home.
Original Mortgage
$157,600
Interest Rate
5.46%
Mortgage Type
Unknown
Purchase Details
Closed on
Apr 19, 1996
Sold by
Niehaus Patrick John and Niehaus Mary Fox
Bought by
Falcone Richard A and Falcone Alexandra E
Home Financials for this Owner
Home Financials are based on the most recent Mortgage that was taken out on this home.
Original Mortgage
$112,050
Interest Rate
7.91%
Create a Home Valuation Report for This Property
The Home Valuation Report is an in-depth analysis detailing your home's value as well as a comparison with similar homes in the area
Home Values in the Area
Average Home Value in this Area
Purchase History
| Date | Buyer | Sale Price | Title Company |
|---|---|---|---|
| Campbell Eric P | $275,000 | Attorney | |
| Sinclair Tara C | $197,000 | -- | |
| Falcone Richard A | $140,100 | -- |
Source: Public Records
Mortgage History
| Date | Status | Borrower | Loan Amount |
|---|---|---|---|
| Open | Campbell Eric P | $175,000 | |
| Previous Owner | Sinclair Tara C | $157,600 | |
| Previous Owner | Falcone Richard A | $112,050 |
Source: Public Records
Tax History Compared to Growth
Tax History
| Year | Tax Paid | Tax Assessment Tax Assessment Total Assessment is a certain percentage of the fair market value that is determined by local assessors to be the total taxable value of land and additions on the property. | Land | Improvement |
|---|---|---|---|---|
| 2024 | $6,114 | $135,391 | $49,770 | $85,621 |
| 2023 | $6,253 | $135,391 | $49,770 | $85,621 |
| 2022 | $6,388 | $126,819 | $41,251 | $85,568 |
| 2021 | $6,149 | $126,819 | $41,251 | $85,568 |
| 2020 | $8,547 | $126,819 | $41,251 | $85,568 |
| 2019 | $6,114 | $82,964 | $35,560 | $47,404 |
| 2018 | $6,124 | $82,964 | $35,560 | $47,404 |
| 2017 | $5,817 | $82,964 | $35,560 | $47,404 |
| 2016 | $7,459 | $104,913 | $32,809 | $72,104 |
| 2015 | $6,724 | $104,913 | $32,809 | $72,104 |
| 2014 | $6,772 | $104,913 | $32,809 | $72,104 |
| 2013 | $6,322 | $96,250 | $30,100 | $66,150 |
Source: Public Records
Map
Nearby Homes
- 3744 Aylesboro Ave
- 3668 Wilshire Ave
- 3630 Bellecrest Ave
- 3646 Ashworth Dr
- 3538 Forestoak Ct
- 3713 Erie Ave
- 3474 Forestoak Ct
- 3641 Brentwood Ave
- 3529 Pembroke Ave
- 25 Observatory Hill
- 3460 Custer Ave
- 3425 Pape Ave
- 3525 Deepwoods Ln
- 19 Greenhouse Ln
- 3614 Marburg Ave
- 3458 Observatory Place
- 4422 Canyon Oak Ct
- 4418 Canyon Oak Ct
- 2947 Iron Oak Ln
- 3508 Tarpis Ave
- 3771 Aylesboro Ave
- 3767 Aylesboro Ave
- 3773 Aylesboro Ave
- 3751 Aylesboro Ave
- 3775 Aylesboro Ave
- 3768 Ault Park Ave
- 3772 Ault Park Ave
- 3766 Ault Park Ave
- 3778 Ault Park Ave
- 3762 Ault Park Ave
- 3779 Aylesboro Ave
- 3743 Aylesboro Ave
- 3780 Ault Park Ave
- 3760 Ault Park Ave
- 3766 Aylesboro Ave
- 3764 Aylesboro Ave
- 3770 Aylesboro Ave
- 3756 Aylesboro Ave
- 3774 Aylesboro Ave
- 3756 Ault Park Ave