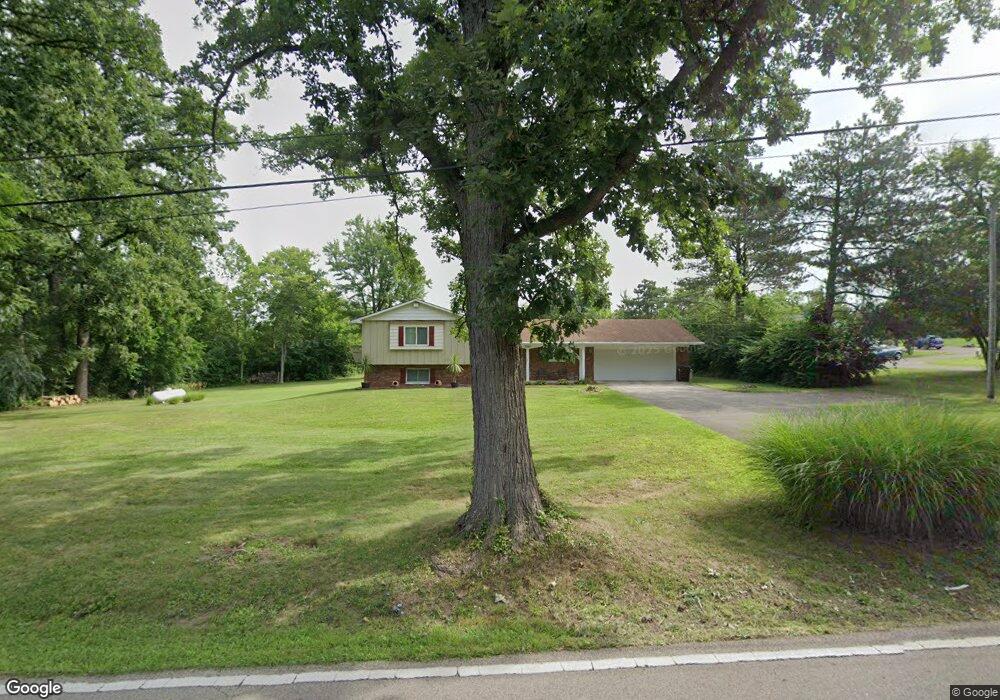
3769 Belvo Rd Miamisburg, OH 45342
Estimated Value: $225,000 - $325,000
3
Beds
3
Baths
2,194
Sq Ft
$132/Sq Ft
Est. Value
About This Home
This home is located at 3769 Belvo Rd, Miamisburg, OH 45342 and is currently estimated at $290,415, approximately $132 per square foot. 3769 Belvo Rd is a home located in Montgomery County with nearby schools including Miamisburg High School, Bishop Leibold School, and Dayton Christian School.
Ownership History
Date
Name
Owned For
Owner Type
Purchase Details
Closed on
Dec 18, 2017
Sold by
Holbrook Carol L
Bought by
Holbrook Steven W
Current Estimated Value
Home Financials for this Owner
Home Financials are based on the most recent Mortgage that was taken out on this home.
Original Mortgage
$93,000
Outstanding Balance
$78,257
Interest Rate
3.92%
Mortgage Type
New Conventional
Estimated Equity
$212,158
Purchase Details
Closed on
Feb 12, 2007
Sold by
Fannie Mae
Bought by
Holbrook Steven W and Holbrook Carol L
Home Financials for this Owner
Home Financials are based on the most recent Mortgage that was taken out on this home.
Original Mortgage
$21,980
Interest Rate
6.27%
Mortgage Type
Stand Alone Second
Purchase Details
Closed on
Jan 16, 2006
Sold by
Mitchell James E and Washington Mutual Bank Fa
Bought by
Federal National Mortgage Association
Create a Home Valuation Report for This Property
The Home Valuation Report is an in-depth analysis detailing your home's value as well as a comparison with similar homes in the area
Home Values in the Area
Average Home Value in this Area
Purchase History
| Date | Buyer | Sale Price | Title Company |
|---|---|---|---|
| Holbrook Steven W | -- | Sterling Land Title Agency I | |
| Holbrook Steven W | $109,900 | None Available | |
| Federal National Mortgage Association | $92,000 | None Available |
Source: Public Records
Mortgage History
| Date | Status | Borrower | Loan Amount |
|---|---|---|---|
| Open | Holbrook Steven W | $93,000 | |
| Closed | Holbrook Steven W | $21,980 | |
| Closed | Holbrook Steven W | $87,920 |
Source: Public Records
Tax History Compared to Growth
Tax History
| Year | Tax Paid | Tax Assessment Tax Assessment Total Assessment is a certain percentage of the fair market value that is determined by local assessors to be the total taxable value of land and additions on the property. | Land | Improvement |
|---|---|---|---|---|
| 2024 | $5,134 | $73,620 | $11,200 | $62,420 |
| 2023 | $5,134 | $73,620 | $11,200 | $62,420 |
| 2022 | $5,168 | $62,930 | $9,580 | $53,350 |
| 2021 | $4,876 | $62,930 | $9,580 | $53,350 |
| 2020 | $4,795 | $62,930 | $9,580 | $53,350 |
| 2019 | $3,668 | $43,550 | $9,580 | $33,970 |
| 2018 | $3,642 | $43,550 | $9,580 | $33,970 |
| 2017 | $3,620 | $43,550 | $9,580 | $33,970 |
| 2016 | $3,745 | $43,210 | $9,580 | $33,630 |
| 2015 | $3,682 | $43,210 | $9,580 | $33,630 |
| 2014 | $3,682 | $43,210 | $9,580 | $33,630 |
| 2012 | -- | $48,160 | $9,580 | $38,580 |
Source: Public Records
Map
Nearby Homes
- 2279 Rosina Dr
- 712 Decker Dr
- 736 Decker Dr
- 628 Jamestown Dr
- 1157 Bonniebrook Dr
- 2141 Rosina Dr
- 2127 Carrington Ln
- 3902 Augusta Rd
- 9220 Sawgrass Dr
- 9228 Sawgrass Dr
- 1 Pendle Point
- 9539 Byers Rd
- 2968 Asbury Ct
- 2475 Byers Ridge Dr
- 1131 Castleton Ct
- 1826 Ashley Dr
- 1808 Burnside Dr
- 615 Burnside Dr
- 766 Dunaway St
- 1834 Mellow Dr