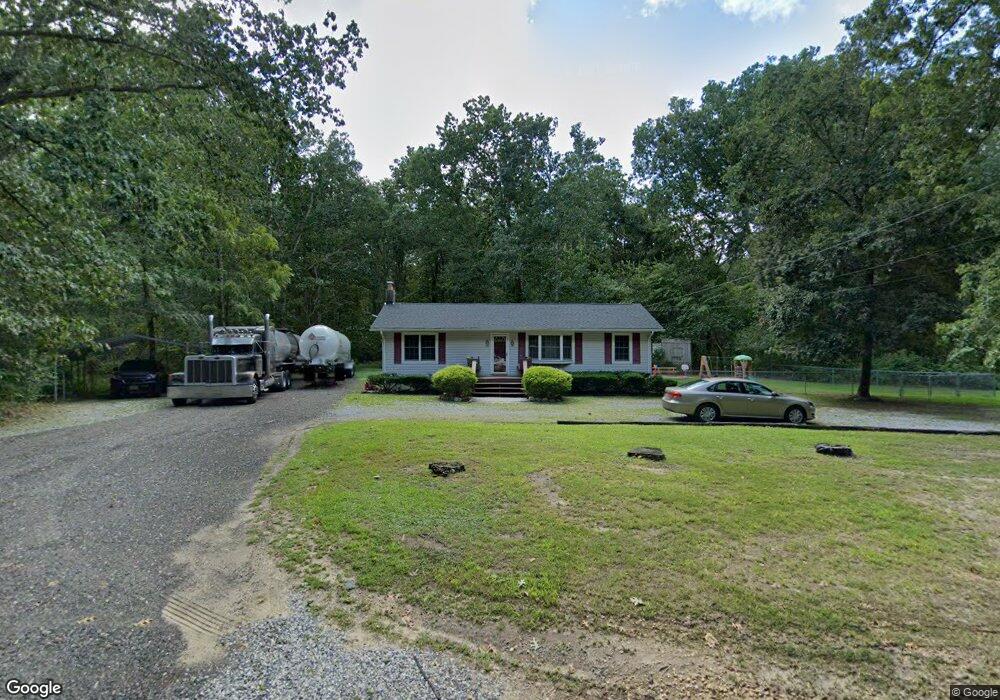
377 3 Bridge Rd Newfield, NJ 08344
Estimated Value: $172,000 - $342,000
Studio
--
Bath
945
Sq Ft
$275/Sq Ft
Est. Value
About This Home
This home is located at 377 3 Bridge Rd, Newfield, NJ 08344 and is currently estimated at $260,179, approximately $275 per square foot. 377 3 Bridge Rd is a home located in Salem County with nearby schools including Upper Pittsgrove School.
Ownership History
Date
Name
Owned For
Owner Type
Purchase Details
Closed on
Feb 20, 1998
Sold by
Bilsing David A and Bilsing Cindy D
Bought by
Richmond Michael E and Richmond Tara L
Current Estimated Value
Home Financials for this Owner
Home Financials are based on the most recent Mortgage that was taken out on this home.
Original Mortgage
$95,050
Outstanding Balance
$16,722
Interest Rate
6.93%
Mortgage Type
FHA
Estimated Equity
$243,457
Purchase Details
Closed on
Apr 27, 1995
Sold by
Renshaw Mary J and Renshaw Maurice J
Bought by
Bilsing David A and Mcquade Cindy D
Create a Home Valuation Report for This Property
The Home Valuation Report is an in-depth analysis detailing your home's value as well as a comparison with similar homes in the area
Purchase History
| Date | Buyer | Sale Price | Title Company |
|---|---|---|---|
| Richmond Michael E | $95,000 | -- | |
| Bilsing David A | $75,000 | Homestead Title Agency |
Source: Public Records
Mortgage History
| Date | Status | Borrower | Loan Amount |
|---|---|---|---|
| Open | Richmond Michael E | $95,050 |
Source: Public Records
Tax History
| Year | Tax Paid | Tax Assessment Tax Assessment Total Assessment is a certain percentage of the fair market value that is determined by local assessors to be the total taxable value of land and additions on the property. | Land | Improvement |
|---|---|---|---|---|
| 2025 | $5,017 | $162,900 | $59,300 | $103,600 |
| 2024 | $4,856 | $162,900 | $59,300 | $103,600 |
| 2023 | $4,856 | $162,900 | $59,300 | $103,600 |
| 2022 | $4,749 | $162,900 | $59,300 | $103,600 |
| 2021 | $4,558 | $162,900 | $59,300 | $103,600 |
| 2020 | $4,436 | $162,900 | $59,300 | $103,600 |
| 2019 | $4,185 | $159,000 | $86,000 | $73,000 |
| 2018 | $3,996 | $159,000 | $86,000 | $73,000 |
| 2017 | $3,992 | $159,000 | $86,000 | $73,000 |
| 2016 | $3,818 | $159,000 | $86,000 | $73,000 |
| 2015 | $3,600 | $159,000 | $86,000 | $73,000 |
| 2014 | $3,477 | $159,000 | $86,000 | $73,000 |
Source: Public Records
Map
Nearby Homes
- 141 Taylor Rd
- 4 Hazelwood Dr Unit 4
- 29 Elmwood Dr
- 72 Hazelwood Dr
- 22 Schalick Dr
- 6 Hazelwood Dr
- 20 Hazelwood Dr
- 18 Birchwood Dr
- 461 3 Bridge Rd
- 595 Royal Ave
- 122 Hazelwood Dr
- 9 Cynthia Place
- 248 Harding Hwy Unit E8
- 248 Route 40
- 248 Harding Hwy
- 9 Harding Dr
- 30 2nd St
- 32 5th St
- 124 Idle Lake Rd
- 1237 Porchtown Rd
Your Personal Tour Guide
Ask me questions while you tour the home.