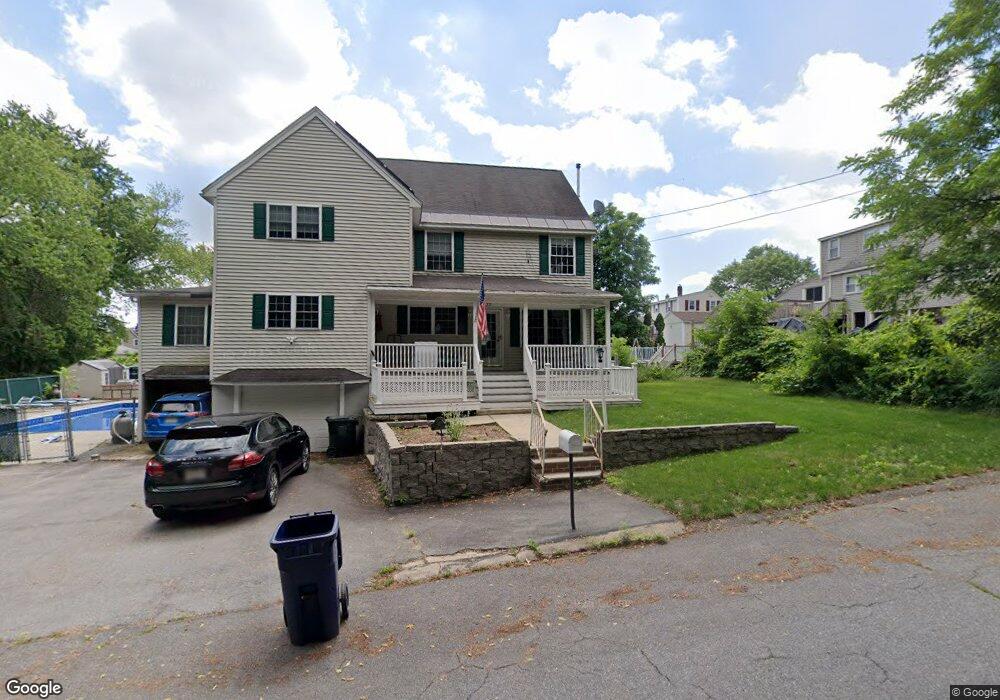
377 4th Ave Dracut, MA 01826
Estimated Value: $678,000 - $760,000
4
Beds
5
Baths
2,586
Sq Ft
$277/Sq Ft
Est. Value
About This Home
This home is located at 377 4th Ave, Dracut, MA 01826 and is currently estimated at $715,664, approximately $276 per square foot. 377 4th Ave is a home located in Middlesex County with nearby schools including George H. Englesby Elementary School, Richardson Middle School, and Dracut Senior High School.
Ownership History
Date
Name
Owned For
Owner Type
Purchase Details
Closed on
Mar 21, 2017
Sold by
Sheehan Kenneth R
Bought by
Sheehan Kenneth R and Sheehan Shirley T
Current Estimated Value
Purchase Details
Closed on
Dec 24, 1998
Sold by
Therriault Maurice A and Therriault Elaine M
Bought by
Sheehan Kenneth R and Sheehan Shawna E
Home Financials for this Owner
Home Financials are based on the most recent Mortgage that was taken out on this home.
Original Mortgage
$104,295
Interest Rate
6.89%
Mortgage Type
Purchase Money Mortgage
Purchase Details
Closed on
Oct 1, 1996
Sold by
Therriault Maurice and Therriault Elaine
Bought by
Sheehan Shirley
Create a Home Valuation Report for This Property
The Home Valuation Report is an in-depth analysis detailing your home's value as well as a comparison with similar homes in the area
Home Values in the Area
Average Home Value in this Area
Purchase History
| Date | Buyer | Sale Price | Title Company |
|---|---|---|---|
| Sheehan Kenneth R | -- | -- | |
| Sheehan Kenneth R | $125,000 | -- | |
| Sheehan Shirley | $125,000 | -- |
Source: Public Records
Mortgage History
| Date | Status | Borrower | Loan Amount |
|---|---|---|---|
| Previous Owner | Sheehan Shirley | $129,000 | |
| Previous Owner | Sheehan Shirley | $104,295 |
Source: Public Records
Tax History
| Year | Tax Paid | Tax Assessment Tax Assessment Total Assessment is a certain percentage of the fair market value that is determined by local assessors to be the total taxable value of land and additions on the property. | Land | Improvement |
|---|---|---|---|---|
| 2025 | $6,606 | $652,800 | $197,400 | $455,400 |
| 2024 | $6,541 | $625,900 | $188,000 | $437,900 |
| 2023 | $6,355 | $548,800 | $163,400 | $385,400 |
| 2022 | $6,210 | $505,300 | $148,500 | $356,800 |
| 2021 | $9,927 | $458,900 | $135,000 | $323,900 |
| 2020 | $5,773 | $432,400 | $131,100 | $301,300 |
| 2019 | $142 | $401,200 | $124,800 | $276,400 |
| 2018 | $7,376 | $389,900 | $124,800 | $265,100 |
| 2017 | $5,456 | $389,900 | $124,800 | $265,100 |
| 2016 | $5,311 | $357,900 | $120,000 | $237,900 |
| 2015 | $5,226 | $350,000 | $120,000 | $230,000 |
| 2014 | $4,867 | $335,900 | $120,000 | $215,900 |
Source: Public Records
Map
Nearby Homes
- 94 Hampson St
- 49 Sparks St
- 244 White St
- 39 Phoebe Ave
- 75 Sladen St
- 28 Sarah Ave
- 16 Peabody Ave
- 101 Donohue Rd Unit 19
- 45 Hoover St
- 25 Shea St Unit 8
- 15 Louis Farm Rd Unit 15
- 26 Farmland Rd Unit C
- 19 Louis Farm Rd Unit 19
- 13 Louis Farm Rd Unit 13
- 51 Tobey Rd Unit 46
- 51 Tobey Rd Unit 47
- 30 4th Ave
- 25 Tobey Rd Unit 57
- 89 Mammoth Rd
- 109 Navy Yard Rd
Your Personal Tour Guide
Ask me questions while you tour the home.