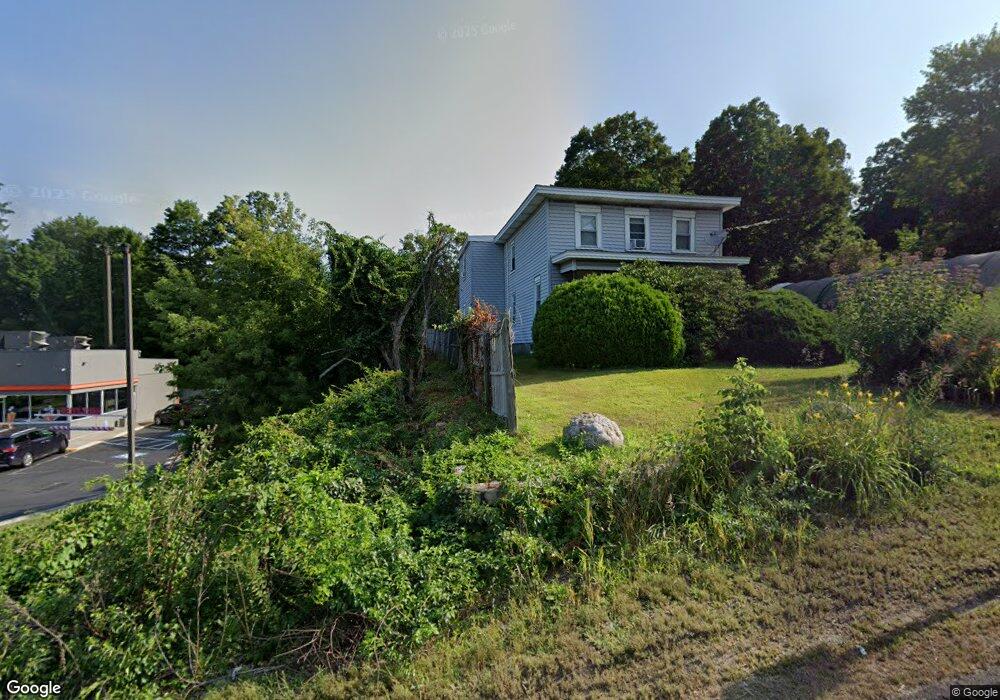
377 E Main St Thomaston, CT 06787
Estimated Value: $251,000 - $275,000
4
Beds
2
Baths
1,786
Sq Ft
$149/Sq Ft
Est. Value
About This Home
This home is located at 377 E Main St, Thomaston, CT 06787 and is currently estimated at $265,436, approximately $148 per square foot. 377 E Main St is a home located in Litchfield County with nearby schools including Black Rock School, Thomaston Center School, and Thomaston High School.
Ownership History
Date
Name
Owned For
Owner Type
Purchase Details
Closed on
Jun 7, 2024
Sold by
Finke Corey J
Bought by
Finke Kayleigh
Current Estimated Value
Home Financials for this Owner
Home Financials are based on the most recent Mortgage that was taken out on this home.
Original Mortgage
$179,428
Outstanding Balance
$176,891
Interest Rate
7.17%
Mortgage Type
Purchase Money Mortgage
Estimated Equity
$88,545
Purchase Details
Closed on
Mar 17, 2017
Sold by
Finke Neil
Bought by
Finke Neil and Finke Corey J
Purchase Details
Closed on
Mar 17, 1998
Sold by
Ficca Thom
Bought by
Finke Neil
Purchase Details
Closed on
Aug 14, 1987
Sold by
Sullivan Eugene P
Bought by
Ficca Thomas J
Create a Home Valuation Report for This Property
The Home Valuation Report is an in-depth analysis detailing your home's value as well as a comparison with similar homes in the area
Home Values in the Area
Average Home Value in this Area
Purchase History
| Date | Buyer | Sale Price | Title Company |
|---|---|---|---|
| Finke Kayleigh | $250,000 | None Available | |
| Finke Kayleigh | $250,000 | None Available | |
| Finke Neil | -- | -- | |
| Finke Neil | -- | -- | |
| Finke Neil | $97,000 | -- | |
| Finke Neil | $97,000 | -- | |
| Ficca Thomas J | $135,000 | -- |
Source: Public Records
Mortgage History
| Date | Status | Borrower | Loan Amount |
|---|---|---|---|
| Open | Finke Kayleigh | $179,428 | |
| Closed | Finke Kayleigh | $179,428 | |
| Previous Owner | Ficca Thomas J | $200,891 | |
| Previous Owner | Ficca Thomas J | $195,000 |
Source: Public Records
Tax History
| Year | Tax Paid | Tax Assessment Tax Assessment Total Assessment is a certain percentage of the fair market value that is determined by local assessors to be the total taxable value of land and additions on the property. | Land | Improvement |
|---|---|---|---|---|
| 2025 | $4,866 | $135,870 | $42,840 | $93,030 |
| 2024 | $4,668 | $135,870 | $42,840 | $93,030 |
| 2023 | $4,569 | $135,870 | $42,840 | $93,030 |
| 2022 | $4,363 | $135,870 | $42,840 | $93,030 |
| 2021 | $3,609 | $99,890 | $42,840 | $57,050 |
| 2020 | $3,609 | $99,890 | $42,840 | $57,050 |
| 2019 | $3,649 | $99,890 | $42,840 | $57,050 |
| 2018 | $3,575 | $99,890 | $42,840 | $57,050 |
| 2017 | $3,501 | $99,890 | $42,840 | $57,050 |
| 2016 | $3,737 | $109,690 | $41,370 | $68,320 |
| 2015 | $3,689 | $109,690 | $41,370 | $68,320 |
| 2014 | $3,689 | $109,690 | $41,370 | $68,320 |
Source: Public Records
Map
Nearby Homes
- 785 Main St
- 22 Park St
- 102 Elm St
- 56 Hillside Ave
- 7 South St
- 16 Grand St
- 713 Pine Hill Blvd
- 211 Pine Hill Blvd Unit 211
- 41 South St
- 58 Litchfield St
- 120 Hotchkiss Ave
- 23 Keegan Rd
- 123 Todd Hollow Rd
- 37 Steven's Blvd Unit 49
- 3 Ellen Ln
- 63 Ridge Rd
- 74 Ridge Rd
- 15 Scott Rd
- 143 Pine Hill Rd Unit 17A
- 143 Pine Hill Rd Unit 15F
- 387 E Main St
- 42 Stoughton St
- 32 Stoughton St
- 52 Stoughton St
- 22 Stoughton St
- 0 Prospect St
- 403 E Main St
- 380 E Main St
- 390A E Main St
- 4 Prospect St
- 390 E Main St
- 64 Stoughton St
- 362 E Main St
- 41 Stoughton St
- 31 Stoughton St
- 47 Stoughton St
- 411 E Main St
- 23 Stoughton St
- 70 Stoughton St
- 111 Broadview Heights
Your Personal Tour Guide
Ask me questions while you tour the home.