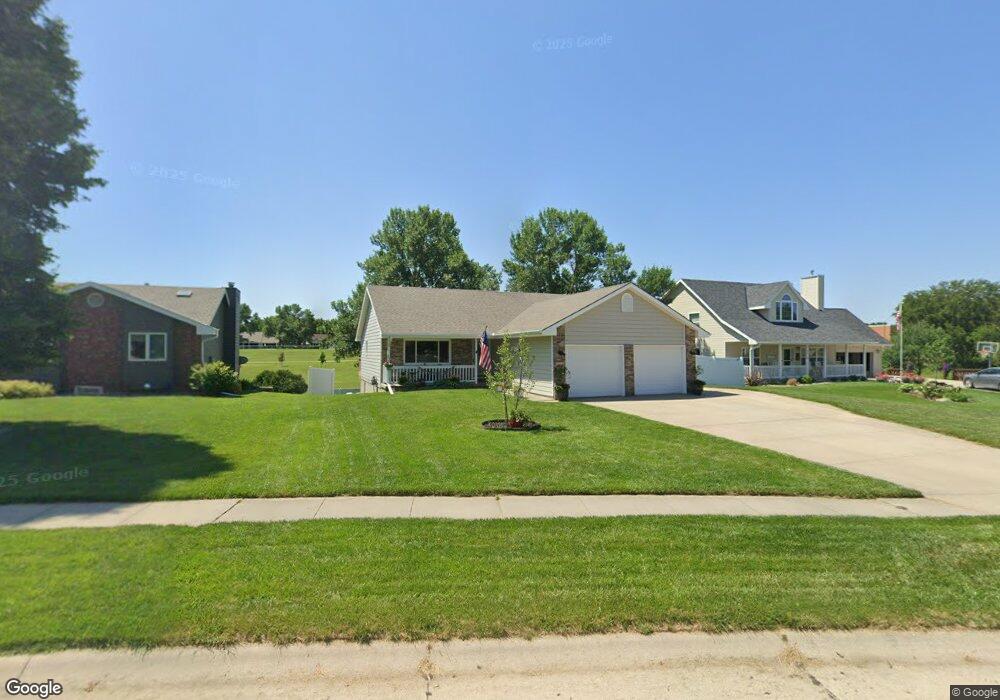
377 E Star St Seward, NE 68434
Estimated Value: $332,016 - $356,000
4
Beds
3
Baths
1,995
Sq Ft
$172/Sq Ft
Est. Value
About This Home
This home is located at 377 E Star St, Seward, NE 68434 and is currently estimated at $343,254, approximately $172 per square foot. 377 E Star St is a home located in Seward County with nearby schools including Seward Elementary School, Seward Middle School, and Seward High School.
Ownership History
Date
Name
Owned For
Owner Type
Purchase Details
Closed on
Mar 12, 2025
Sold by
Dupic Ryan and Dupic Abby
Bought by
Happ Mikhail
Current Estimated Value
Home Financials for this Owner
Home Financials are based on the most recent Mortgage that was taken out on this home.
Original Mortgage
$320,000
Outstanding Balance
$317,837
Interest Rate
6.95%
Mortgage Type
New Conventional
Estimated Equity
$25,417
Purchase Details
Closed on
Jul 31, 2014
Sold by
Mason Bryan S
Bought by
Dupic Ryan and Dupic Abby
Home Financials for this Owner
Home Financials are based on the most recent Mortgage that was taken out on this home.
Original Mortgage
$170,100
Interest Rate
3.5%
Mortgage Type
Adjustable Rate Mortgage/ARM
Purchase Details
Closed on
Feb 27, 2012
Sold by
Snavely Alex B and Snavely Karen S
Bought by
Mason Bryan S
Home Financials for this Owner
Home Financials are based on the most recent Mortgage that was taken out on this home.
Original Mortgage
$135,920
Interest Rate
3.93%
Mortgage Type
New Conventional
Create a Home Valuation Report for This Property
The Home Valuation Report is an in-depth analysis detailing your home's value as well as a comparison with similar homes in the area
Home Values in the Area
Average Home Value in this Area
Purchase History
We collect this data history from publicly available records. To have your information removed, we recommend requesting removal directly through your county’s website.
| Date | Buyer | Sale Price | Title Company |
|---|---|---|---|
| Happ Mikhail | $320,000 | Home Services Title | |
| Dupic Ryan | $189,000 | Nebraska Land Title & Abstra | |
| Mason Bryan S | $170,000 | None Available |
Source: Public Records
Mortgage History
We collect this data history from publicly available records. To have your information removed, we recommend requesting removal directly through your county’s website.
| Date | Status | Borrower | Loan Amount |
|---|---|---|---|
| Open | Happ Mikhail | $320,000 | |
| Previous Owner | Dupic Ryan | $170,100 | |
| Previous Owner | Mason Bryan S | $135,920 |
Source: Public Records
Tax History
| Year | Tax Paid | Tax Assessment Tax Assessment Total Assessment is a certain percentage of the fair market value that is determined by local assessors to be the total taxable value of land and additions on the property. | Land | Improvement |
|---|---|---|---|---|
| 2025 | $2,995 | $278,402 | $33,065 | $245,337 |
| 2024 | $3,092 | $270,965 | $30,009 | $240,956 |
| 2023 | $3,622 | $249,060 | $30,009 | $219,051 |
| 2022 | $3,592 | $223,188 | $30,009 | $193,179 |
| 2021 | $3,294 | $202,490 | $30,009 | $172,481 |
| 2020 | $3,336 | $202,490 | $30,009 | $172,481 |
| 2019 | $3,061 | $187,850 | $30,078 | $157,772 |
| 2018 | $2,927 | $181,532 | $27,949 | $153,583 |
| 2017 | $2,849 | $189,598 | $26,577 | $163,021 |
| 2016 | $2,699 | $166,239 | $26,618 | $139,621 |
| 2015 | $2,741 | $166,239 | $26,618 | $139,621 |
| 2013 | $2,895 | $156,214 | $22,695 | $133,519 |
Source: Public Records
Map
Nearby Homes
- 1501 Kolterman Ave
- 2456 N Columbia Ave
- 455 Graham Park Dr
- 120 Hillcrest Dr
- 614 North Ave
- 1325 N 8th St
- 728 N 3rd St
- TBD N 8th St
- 54 Lincoln St
- 527 Grand Ave
- 456 N Columbia Ave
- 11 Roberts St
- 1111 Ironwood Dr
- 410 N 3rd St
- 1139 Ironwood Dr
- 1057 N 12th St
- 247 N 2nd St
- 210 Greenwood Ave
- 406 N 7th St
- 1755 280th
Your Personal Tour Guide
Ask me questions while you tour the home.