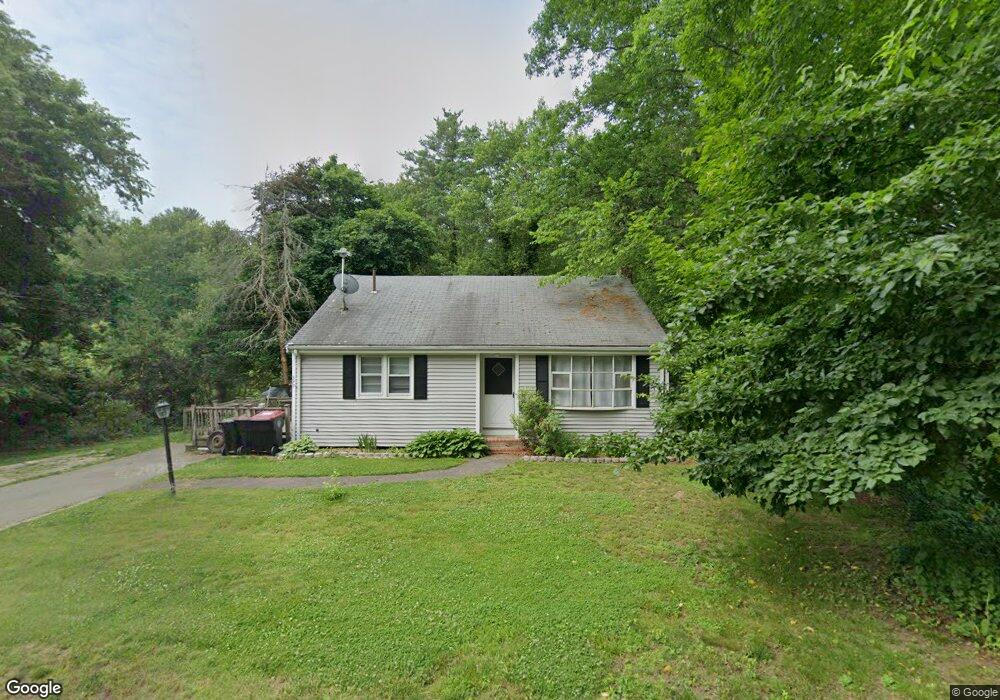
377 East St Brockton, MA 02302
Estimated Value: $457,000 - $501,000
3
Beds
1
Bath
1,414
Sq Ft
$343/Sq Ft
Est. Value
About This Home
This home is located at 377 East St, Brockton, MA 02302 and is currently estimated at $485,333, approximately $343 per square foot. 377 East St is a home located in Plymouth County with nearby schools including Davis K-8 School, John F. Kennedy Elementary School, and South Middle School.
Ownership History
Date
Name
Owned For
Owner Type
Purchase Details
Closed on
Jun 22, 1995
Sold by
Walton Kenneth T and Walton Janet M
Bought by
Walton Kenneth T
Current Estimated Value
Home Financials for this Owner
Home Financials are based on the most recent Mortgage that was taken out on this home.
Original Mortgage
$53,000
Interest Rate
7.82%
Mortgage Type
Purchase Money Mortgage
Create a Home Valuation Report for This Property
The Home Valuation Report is an in-depth analysis detailing your home's value as well as a comparison with similar homes in the area
Home Values in the Area
Average Home Value in this Area
Purchase History
| Date | Buyer | Sale Price | Title Company |
|---|---|---|---|
| Walton Kenneth T | $20,000 | -- |
Source: Public Records
Mortgage History
| Date | Status | Borrower | Loan Amount |
|---|---|---|---|
| Closed | Walton Kenneth T | $53,000 | |
| Previous Owner | Walton Kenneth T | $50,000 |
Source: Public Records
Tax History Compared to Growth
Tax History
| Year | Tax Paid | Tax Assessment Tax Assessment Total Assessment is a certain percentage of the fair market value that is determined by local assessors to be the total taxable value of land and additions on the property. | Land | Improvement |
|---|---|---|---|---|
| 2025 | $4,949 | $408,700 | $158,600 | $250,100 |
| 2024 | $4,767 | $396,600 | $158,600 | $238,000 |
| 2023 | $4,647 | $358,000 | $108,800 | $249,200 |
| 2022 | $4,549 | $325,600 | $98,800 | $226,800 |
| 2021 | $3,986 | $274,900 | $91,300 | $183,600 |
| 2020 | $3,910 | $258,100 | $80,300 | $177,800 |
| 2019 | $4,089 | $263,100 | $76,400 | $186,700 |
| 2018 | $3,487 | $217,100 | $76,400 | $140,700 |
| 2017 | $3,413 | $212,000 | $76,400 | $135,600 |
| 2016 | $3,144 | $181,100 | $72,900 | $108,200 |
| 2015 | $2,868 | $158,000 | $72,900 | $85,100 |
| 2014 | $2,774 | $153,000 | $72,900 | $80,100 |
Source: Public Records
Map
Nearby Homes