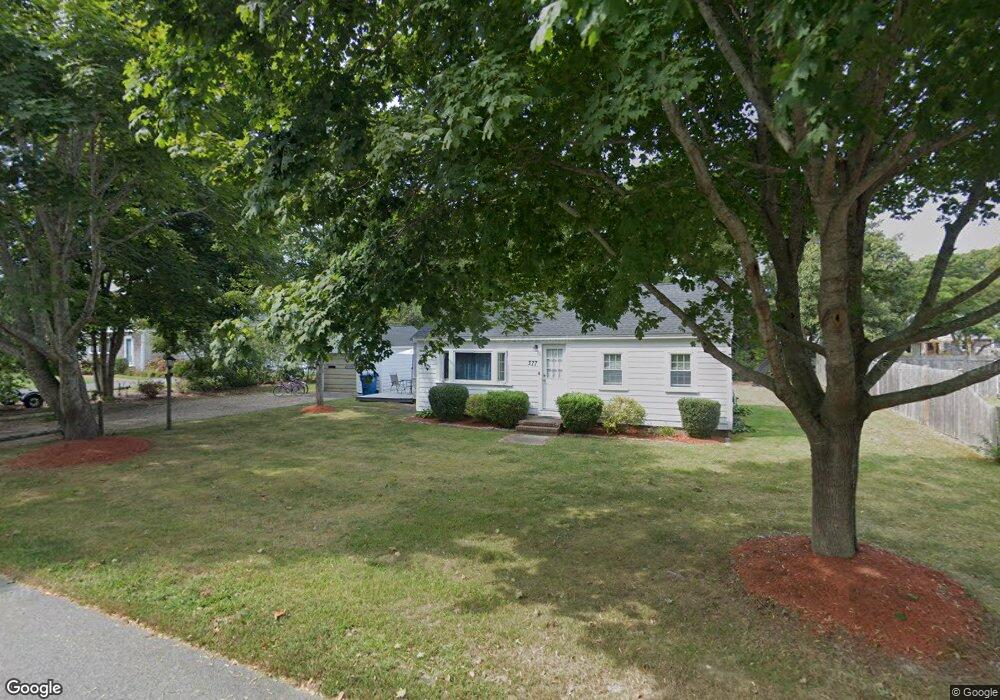
377 Edgewater Dr E East Falmouth, MA 02536
East Falmouth NeighborhoodEstimated Value: $523,140 - $682,000
2
Beds
1
Bath
800
Sq Ft
$777/Sq Ft
Est. Value
About This Home
This home is located at 377 Edgewater Dr E, East Falmouth, MA 02536 and is currently estimated at $621,785, approximately $777 per square foot. 377 Edgewater Dr E is a home located in Barnstable County with nearby schools including East Falmouth Elementary School, Morse Pond School, and Lawrence School.
Ownership History
Date
Name
Owned For
Owner Type
Purchase Details
Closed on
Jul 14, 2004
Sold by
Bowman Christina A and Bowman John L
Bought by
Campbell Gary A
Current Estimated Value
Home Financials for this Owner
Home Financials are based on the most recent Mortgage that was taken out on this home.
Original Mortgage
$258,900
Outstanding Balance
$127,753
Interest Rate
6.25%
Mortgage Type
Purchase Money Mortgage
Estimated Equity
$494,032
Create a Home Valuation Report for This Property
The Home Valuation Report is an in-depth analysis detailing your home's value as well as a comparison with similar homes in the area
Home Values in the Area
Average Home Value in this Area
Purchase History
| Date | Buyer | Sale Price | Title Company |
|---|---|---|---|
| Campbell Gary A | $334,000 | -- | |
| Campbell Gary A | $334,000 | -- |
Source: Public Records
Mortgage History
| Date | Status | Borrower | Loan Amount |
|---|---|---|---|
| Open | Campbell Gary A | $258,900 | |
| Closed | Campbell Gary A | $258,900 | |
| Previous Owner | Campbell Gary A | $191,000 |
Source: Public Records
Tax History Compared to Growth
Tax History
| Year | Tax Paid | Tax Assessment Tax Assessment Total Assessment is a certain percentage of the fair market value that is determined by local assessors to be the total taxable value of land and additions on the property. | Land | Improvement |
|---|---|---|---|---|
| 2025 | $2,713 | $462,100 | $247,800 | $214,300 |
| 2024 | $2,624 | $417,900 | $236,000 | $181,900 |
| 2023 | $2,717 | $392,600 | $236,000 | $156,600 |
| 2022 | $2,469 | $306,700 | $175,600 | $131,100 |
| 2021 | $2,502 | $294,300 | $175,600 | $118,700 |
| 2020 | $2,391 | $278,300 | $159,600 | $118,700 |
| 2019 | $2,333 | $272,500 | $159,600 | $112,900 |
| 2018 | $2,243 | $260,800 | $159,600 | $101,200 |
| 2017 | $2,199 | $257,800 | $159,600 | $98,200 |
| 2016 | $2,158 | $257,800 | $159,600 | $98,200 |
| 2015 | $2,111 | $257,800 | $159,600 | $98,200 |
| 2014 | $2,125 | $260,700 | $159,600 | $101,100 |
Source: Public Records
Map
Nearby Homes
- 381 Seacoast Shores Blvd
- 15 Ovington Dr
- 285 Edgewater Dr W
- 53 Eel River Rd
- 0 Tobey Ln
- 231 Edgewater Dr W
- 23 N Bournes Pond Rd
- 23 N Bournes Pond Rd
- 42 Hanson Cir
- 15 Pershing Dr
- 11 Pershing Dr
- 7 Yale Dr
- 52 Bacon Farm Rd
- 21 Captain Davis Ln
- 472 & 474 Davisville Rd
- 23 Meadowood Ln
- 30 Weatherglass Ln
- 27 Emerald Ln
- 0 Elsies Way Unit 22505181
- 0 Elsies Way Unit 73443603
- 374 Seacoast Shores Blvd
- 373 Edgewater Dr E
- 381 Edgewater Dr E
- 368 Seacoast Shores Blvd
- 380 Edgewater Dr E
- 386 Edgewater Dr E
- 382 Seacoast Shores Blvd
- 367 Edgewater Dr E
- 41 Fisher Rd
- 370 Edgewater Dr E
- 375 Seacoast Shores Blvd
- 367 Seacoast Blvd
- 367 Seacoast Shores Blvd
- 97 Ipswich Dr
- 381 Seacoast Shores & 0 Ipswich Blvd
- 390 Edgewater Dr E
- 393 Edgewater Dr E
- 364 Edgewater Dr E
- 29 Lynwood Terrace
- 363 Seacoast Shores Blvd