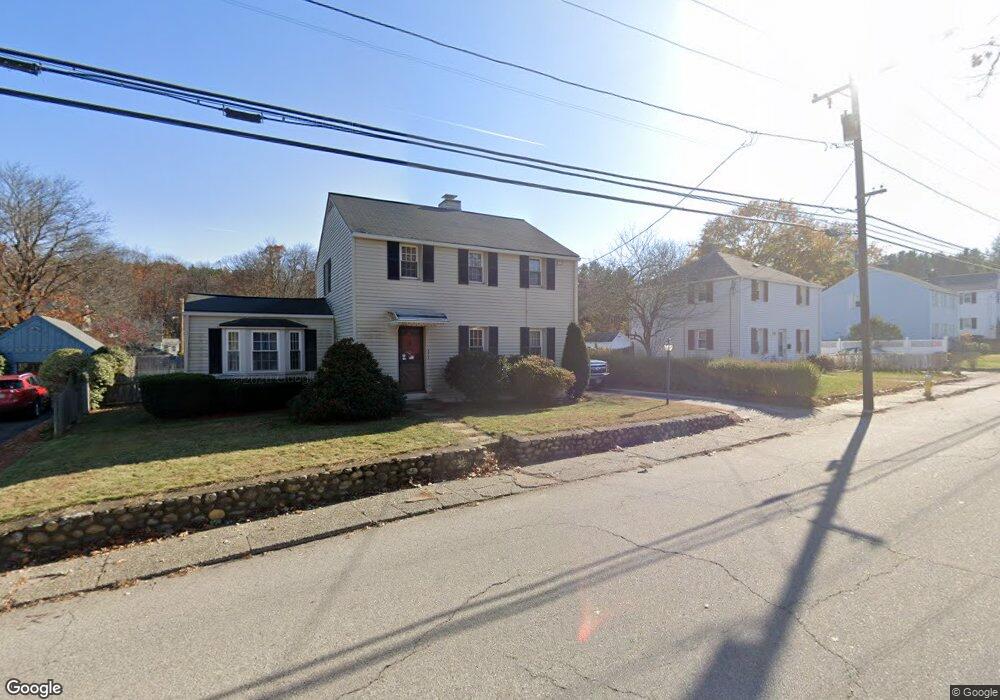
377 Elm St Southbridge, MA 01550
Estimated Value: $336,000 - $373,000
3
Beds
2
Baths
1,468
Sq Ft
$237/Sq Ft
Est. Value
About This Home
This home is located at 377 Elm St, Southbridge, MA 01550 and is currently estimated at $348,525, approximately $237 per square foot. 377 Elm St is a home located in Worcester County with nearby schools including Trinity Catholic Academy and ViewPoint Christian Academy.
Ownership History
Date
Name
Owned For
Owner Type
Purchase Details
Closed on
Aug 31, 2011
Sold by
Green Leon G
Bought by
Quental Danielle M
Current Estimated Value
Home Financials for this Owner
Home Financials are based on the most recent Mortgage that was taken out on this home.
Original Mortgage
$121,831
Outstanding Balance
$84,458
Interest Rate
4.52%
Mortgage Type
Purchase Money Mortgage
Estimated Equity
$264,067
Create a Home Valuation Report for This Property
The Home Valuation Report is an in-depth analysis detailing your home's value as well as a comparison with similar homes in the area
Home Values in the Area
Average Home Value in this Area
Purchase History
| Date | Buyer | Sale Price | Title Company |
|---|---|---|---|
| Quental Danielle M | $125,000 | -- | |
| Quental Danielle M | $125,000 | -- |
Source: Public Records
Mortgage History
| Date | Status | Borrower | Loan Amount |
|---|---|---|---|
| Open | Quental Danielle M | $121,831 | |
| Closed | Quental Danielle M | $121,831 |
Source: Public Records
Tax History Compared to Growth
Tax History
| Year | Tax Paid | Tax Assessment Tax Assessment Total Assessment is a certain percentage of the fair market value that is determined by local assessors to be the total taxable value of land and additions on the property. | Land | Improvement |
|---|---|---|---|---|
| 2025 | $3,996 | $272,600 | $37,900 | $234,700 |
| 2024 | $3,757 | $246,200 | $31,600 | $214,600 |
| 2023 | $3,539 | $223,400 | $31,600 | $191,800 |
| 2022 | $3,365 | $188,000 | $27,000 | $161,000 |
| 2021 | $3,655 | $188,000 | $27,000 | $161,000 |
| 2020 | $3,557 | $182,600 | $27,000 | $155,600 |
| 2018 | $3,067 | $147,800 | $27,000 | $120,800 |
| 2017 | $3,030 | $147,300 | $27,000 | $120,300 |
| 2016 | $2,876 | $142,300 | $27,000 | $115,300 |
| 2015 | $2,447 | $120,200 | $29,700 | $90,500 |
| 2014 | $2,357 | $120,000 | $29,700 | $90,300 |
Source: Public Records
Map
Nearby Homes