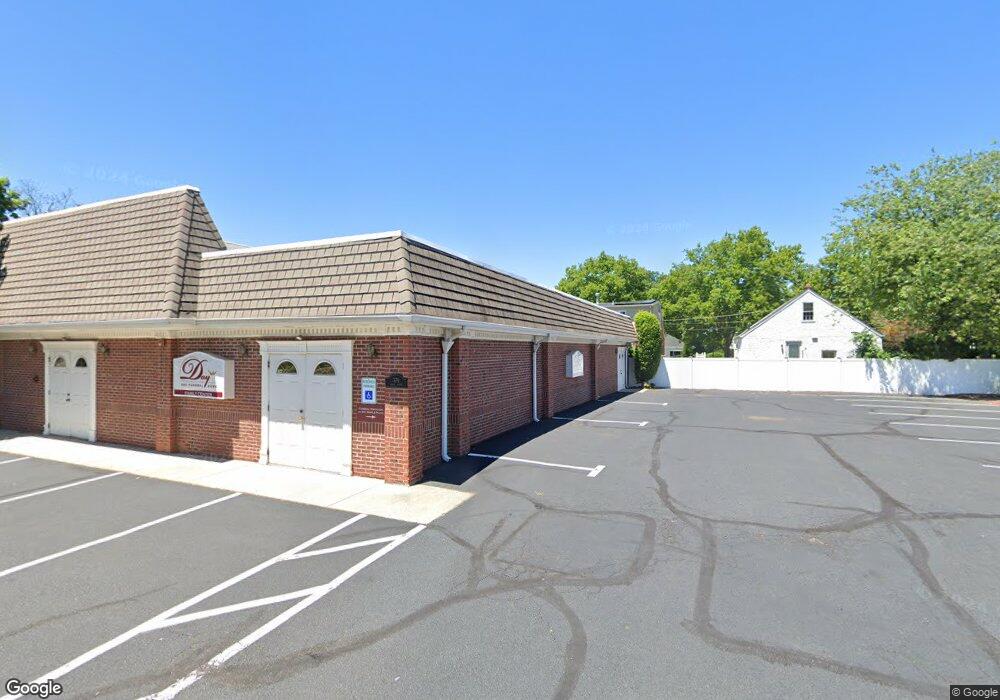
377 Maple Place Keyport, NJ 07735
Estimated Value: $199,000
Studio
--
Bath
--
Sq Ft
5,009
Sq Ft Lot
About This Home
This home is located at 377 Maple Place, Keyport, NJ 07735 and is currently priced at $199,000. 377 Maple Place is a home located in Monmouth County with nearby schools including Keyport Central School, Keyport High School, and St. Joseph Elementary School.
Ownership History
Date
Name
Owned For
Owner Type
Purchase Details
Closed on
May 21, 2014
Sold by
37 Maple Place Llc
Bought by
Central Jersey Investment Group Llc
Current Estimated Value
Home Financials for this Owner
Home Financials are based on the most recent Mortgage that was taken out on this home.
Original Mortgage
$1,635,000
Outstanding Balance
$499,256
Interest Rate
2.75%
Mortgage Type
Purchase Money Mortgage
Purchase Details
Closed on
Sep 23, 1999
Sold by
Mckenzie Brian
Bought by
379 Maple Place Llc
Create a Home Valuation Report for This Property
The Home Valuation Report is an in-depth analysis detailing your home's value as well as a comparison with similar homes in the area
Home Values in the Area
Average Home Value in this Area
Purchase History
| Date | Buyer | Sale Price | Title Company |
|---|---|---|---|
| Central Jersey Investment Group Llc | $180,000 | Commonwealth Title | |
| 379 Maple Place Llc | $275,000 | -- |
Source: Public Records
Mortgage History
| Date | Status | Borrower | Loan Amount |
|---|---|---|---|
| Open | Central Jersey Investment Group Llc | $1,635,000 |
Source: Public Records
Tax History
| Year | Tax Paid | Tax Assessment Tax Assessment Total Assessment is a certain percentage of the fair market value that is determined by local assessors to be the total taxable value of land and additions on the property. | Land | Improvement |
|---|---|---|---|---|
| 2025 | $4,451 | $225,800 | $211,800 | $14,000 |
| 2024 | $4,306 | $215,000 | $201,700 | $13,300 |
| 2023 | $4,306 | $195,900 | $183,300 | $12,600 |
| 2022 | $4,074 | $174,600 | $163,700 | $10,900 |
| 2021 | $4,074 | $161,400 | $151,600 | $9,800 |
| 2020 | $3,909 | $153,700 | $144,400 | $9,300 |
| 2019 | $3,722 | $146,600 | $137,500 | $9,100 |
| 2018 | $3,796 | $146,000 | $137,500 | $8,500 |
| 2017 | $3,804 | $145,900 | $137,500 | $8,400 |
| 2016 | $3,761 | $145,500 | $137,500 | $8,000 |
| 2015 | $3,449 | $132,800 | $125,000 | $7,800 |
| 2014 | $3,164 | $123,000 | $115,000 | $8,000 |
Source: Public Records
Map
Nearby Homes
- 284 Washington St
- 55 Lower Main St
- 52 Highway 35
- 253 Broadway
- 155 Luppatatong Ave
- 154 Lower Main St
- 369 Riverdale Dr
- 95 Broadway
- 207 Lower Main St
- 2 Chingarora Ave
- 3 Harrison Ave
- 5 Barrier Dr
- 46 Parkview Dr
- 81 Village Green Way
- 227 W Prospect Ave
- 9 Kearney St Unit A
- 173 Village Green Way
- 10 Johnson Ave
- 13 Cresci Blvd
- 49 Lucia Ct
- 381 Maple Place
- 297 Washington St
- 19 Orchard St
- 10 Lower Main St
- 21 Orchard St
- 392 Maple Place
- 12 Lower Main St
- 303 Ryan St
- 300 Washington St
- 22 Orchard St
- 400 Maple Place
- 14 Lower Main St
- 1 Lower Main St
- 302 Ryan St
- 296 Washington St
- 305 Ryan St
- 24 Orchard St
- 396 Maple Place
- 16 Lower Main St
- 16 Lower Main St Unit 9
Your Personal Tour Guide
Ask me questions while you tour the home.