Estimated Value: $155,000 - $218,000
2
Beds
1
Bath
848
Sq Ft
$218/Sq Ft
Est. Value
About This Home
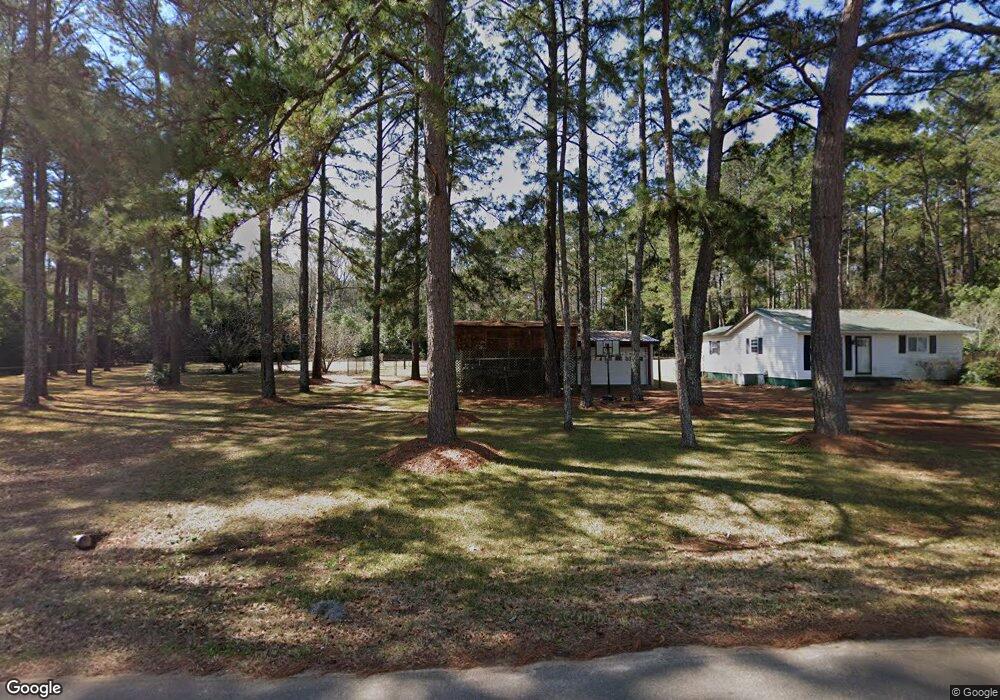
This home is located at 377 N Spring Creek Cir, Cobb, GA 31735 and is currently estimated at $184,574, approximately $217 per square foot. 377 N Spring Creek Cir is a home located in Sumter County with nearby schools including Sumter County Primary School, Sumter County Elementary School, and Sumter County Middle School.
Ownership History
Date
Name
Owned For
Owner Type
Purchase Details
Closed on
Aug 19, 2021
Sold by
Nobles Allie Wurtz
Bought by
Smith Tony W
Current Estimated Value
Purchase Details
Closed on
Sep 18, 2018
Sold by
Goodin Bryan Christopher
Bought by
Wurtz Allie Brewer
Home Financials for this Owner
Home Financials are based on the most recent Mortgage that was taken out on this home.
Original Mortgage
$99,496
Interest Rate
4.5%
Mortgage Type
New Conventional
Purchase Details
Closed on
Apr 3, 2015
Sold by
Bentley Grady T
Bought by
Goodin Bryan Christopher and Goodin Kristen Marie
Home Financials for this Owner
Home Financials are based on the most recent Mortgage that was taken out on this home.
Original Mortgage
$62,045
Interest Rate
3.5%
Mortgage Type
FHA
Purchase Details
Closed on
Jun 20, 1994
Sold by
Brown Mc Etal
Bought by
Bentley Grady T
Purchase Details
Closed on
Jan 1, 1901
Bought by
Brown Mc Etal
Create a Home Valuation Report for This Property
The Home Valuation Report is an in-depth analysis detailing your home's value as well as a comparison with similar homes in the area
Home Values in the Area
Average Home Value in this Area
Purchase History
| Date | Buyer | Sale Price | Title Company |
|---|---|---|---|
| Smith Tony W | $135,000 | -- | |
| Wurtz Allie Brewer | $98,500 | -- | |
| Goodin Bryan Christopher | $63,190 | -- | |
| Bentley Grady T | $600 | -- | |
| Brown Mc Etal | -- | -- |
Source: Public Records
Mortgage History
| Date | Status | Borrower | Loan Amount |
|---|---|---|---|
| Previous Owner | Wurtz Allie Brewer | $99,496 | |
| Previous Owner | Goodin Bryan Christopher | $62,045 |
Source: Public Records
Tax History Compared to Growth
Tax History
| Year | Tax Paid | Tax Assessment Tax Assessment Total Assessment is a certain percentage of the fair market value that is determined by local assessors to be the total taxable value of land and additions on the property. | Land | Improvement |
|---|---|---|---|---|
| 2024 | $1,154 | $22,076 | $4,400 | $17,676 |
| 2023 | $1,132 | $22,076 | $4,400 | $17,676 |
| 2022 | $1,132 | $22,076 | $4,400 | $17,676 |
| 2021 | $1,134 | $22,076 | $4,400 | $17,676 |
| 2020 | $1,157 | $22,076 | $4,400 | $17,676 |
| 2019 | $1,084 | $22,076 | $4,400 | $17,676 |
| 2018 | $1,092 | $22,316 | $4,400 | $17,916 |
| 2017 | $1,092 | $22,316 | $4,400 | $17,916 |
| 2016 | $1,092 | $22,316 | $4,400 | $17,916 |
| 2015 | $1,049 | $21,396 | $4,400 | $16,996 |
| 2014 | $868 | $15,480 | $2,000 | $13,480 |
| 2013 | -- | $15,080 | $1,600 | $13,480 |
Source: Public Records
Map
Nearby Homes
- 0 N Spring Creek Cir
- TBD N Spring Creek Cir
- 108 N Spring Creek Cir
- 252 N Spring Creek Cir
- 115 Cypress Ln
- 113 Cypress Ln
- 114 Water Front Rd
- 170D Cantey Dr
- 152 Cantey Dr
- 101 Rose Ln
- TBD Sawdust Trail
- 151 Gary Brewer Rd
- 121 E Entrekin Rd
- 286 Cannon Branch Rd
- 244 Cannon Branch Rd
- 100 Valhalla
- 154 Cannon Branch Rd
- Lot # 18 Cannon Branch Rd
- Lot #35 Cannon Branch Rd
- Lot #32 Cannon Branch Rd
- 374 N Spring Creek Cir
- 376 N Spring Creek Cir Unit .25
- SS N Spring Creek Cir
- Yyy N Spring Creek Cir
- Xxx N Spring Creek Cir
- Lot 5 N Spring Creek Cir
- Tract B N Spring Creek Cir
- Tract A N Spring Creek Cir
- Tract C N Spring Creek Cir
- N N Spring Creek Cir
- 368 N Spring Creek Cir
- 370 N Spring Creek Cir
- 382 S Spring Creek Creek
- 389 N Spring Creek Cr
- 360 N Spring Creek Cir
- 389 N Spring Creek Cir
- 384 N Spring Creek Cir
- 358 N Spring Creek Cir
- 390 N Spring Creek Cir
- 155 Hillsdale Dr