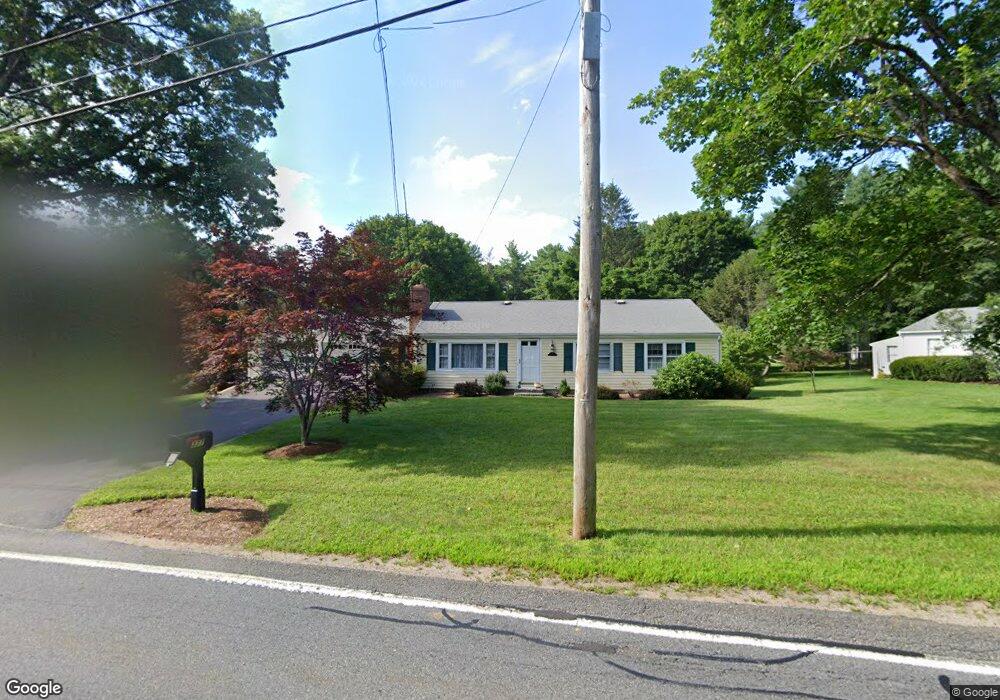
377 Oldham St Pembroke, MA 02359
Estimated Value: $596,000 - $631,000
3
Beds
2
Baths
1,342
Sq Ft
$459/Sq Ft
Est. Value
About This Home
This home is located at 377 Oldham St, Pembroke, MA 02359 and is currently estimated at $615,459, approximately $458 per square foot. 377 Oldham St is a home located in Plymouth County with nearby schools including Pembroke High School.
Ownership History
Date
Name
Owned For
Owner Type
Purchase Details
Closed on
Jun 11, 2018
Sold by
Morrissey Francis M and Morrissey Teresa M
Bought by
Ftm Irt
Current Estimated Value
Purchase Details
Closed on
Jun 30, 1999
Sold by
Est Arnold Richard E and Rosso Joanne L
Bought by
Morrissey Francis M and Morrissey Teresa M
Purchase Details
Closed on
Apr 27, 1988
Sold by
Baker Byron E
Bought by
Arnold Richard E
Home Financials for this Owner
Home Financials are based on the most recent Mortgage that was taken out on this home.
Original Mortgage
$75,500
Interest Rate
9.86%
Mortgage Type
Purchase Money Mortgage
Create a Home Valuation Report for This Property
The Home Valuation Report is an in-depth analysis detailing your home's value as well as a comparison with similar homes in the area
Purchase History
| Date | Buyer | Sale Price | Title Company |
|---|---|---|---|
| Ftm Irt | -- | -- | |
| Morrissey Francis M | $180,000 | -- | |
| Arnold Richard E | $150,000 | -- |
Source: Public Records
Mortgage History
| Date | Status | Borrower | Loan Amount |
|---|---|---|---|
| Previous Owner | Arnold Richard E | $150,000 | |
| Previous Owner | Arnold Richard E | $75,500 |
Source: Public Records
Tax History
| Year | Tax Paid | Tax Assessment Tax Assessment Total Assessment is a certain percentage of the fair market value that is determined by local assessors to be the total taxable value of land and additions on the property. | Land | Improvement |
|---|---|---|---|---|
| 2025 | $6,179 | $514,100 | $306,800 | $207,300 |
| 2024 | $6,098 | $506,900 | $301,600 | $205,300 |
| 2023 | $5,957 | $468,300 | $276,800 | $191,500 |
| 2022 | $5,629 | $397,800 | $231,200 | $166,600 |
| 2021 | $5,281 | $362,200 | $221,200 | $141,000 |
| 2020 | $5,183 | $357,700 | $216,400 | $141,300 |
| 2019 | $4,949 | $339,000 | $206,300 | $132,700 |
| 2018 | $4,720 | $317,000 | $201,100 | $115,900 |
| 2017 | $4,636 | $307,000 | $191,100 | $115,900 |
| 2016 | $4,486 | $294,000 | $178,700 | $115,300 |
| 2015 | $4,222 | $286,400 | $171,100 | $115,300 |
Source: Public Records
Map
Nearby Homes
- 269 Lakeside Rd
- 353 Cross St
- 339 State St
- 134 Crescent St
- 177 Dwelley St
- 66 Wildwood Rd
- 430 Brook Bend Rd
- 285 W Elm St
- 7 Farmside Dr
- 161 Winter St Unit 11
- 60 Summer Path Way
- 26 Stonebridge Dr
- 204 Center St Unit 9
- 114 Graham Hill Dr
- 139 Fairwood Dr
- 108 Waterford Dr
- Lot 6 Way
- 10 Fir Rd
- 84 Liberty St
- 35 Sproul Rd