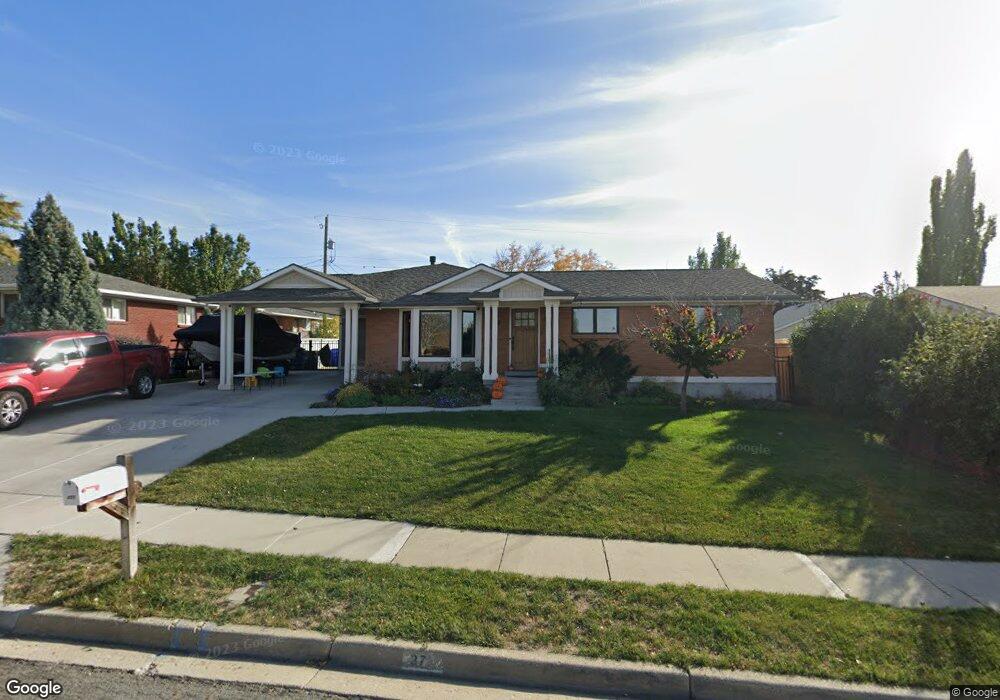
377 W 2300 S Bountiful, UT 84010
Estimated Value: $534,000 - $597,000
5
Beds
2
Baths
1,735
Sq Ft
$326/Sq Ft
Est. Value
About This Home
This home is located at 377 W 2300 S, Bountiful, UT 84010 and is currently estimated at $565,527, approximately $325 per square foot. 377 W 2300 S is a home located in Davis County with nearby schools including Boulton School, South Davis Junior High School, and Woods Cross High School.
Ownership History
Date
Name
Owned For
Owner Type
Purchase Details
Closed on
Nov 12, 1996
Sold by
Wilson Nanci K and Wilson Kevin C
Bought by
Chamberlain Darrel B and Chamberlain Amanda I
Current Estimated Value
Home Financials for this Owner
Home Financials are based on the most recent Mortgage that was taken out on this home.
Original Mortgage
$119,121
Outstanding Balance
$11,708
Interest Rate
8.06%
Mortgage Type
FHA
Estimated Equity
$553,819
Create a Home Valuation Report for This Property
The Home Valuation Report is an in-depth analysis detailing your home's value as well as a comparison with similar homes in the area
Home Values in the Area
Average Home Value in this Area
Purchase History
| Date | Buyer | Sale Price | Title Company |
|---|---|---|---|
| Chamberlain Darrel B | -- | Associated Title Company |
Source: Public Records
Mortgage History
| Date | Status | Borrower | Loan Amount |
|---|---|---|---|
| Open | Chamberlain Darrel B | $119,121 |
Source: Public Records
Tax History Compared to Growth
Tax History
| Year | Tax Paid | Tax Assessment Tax Assessment Total Assessment is a certain percentage of the fair market value that is determined by local assessors to be the total taxable value of land and additions on the property. | Land | Improvement |
|---|---|---|---|---|
| 2025 | $3,280 | $300,300 | $119,363 | $180,937 |
| 2024 | $3,066 | $290,400 | $104,705 | $185,695 |
| 2023 | $2,854 | $489,000 | $195,652 | $293,348 |
| 2022 | $2,953 | $277,750 | $107,658 | $170,092 |
| 2021 | $2,667 | $383,000 | $140,764 | $242,236 |
| 2020 | $2,369 | $341,000 | $121,260 | $219,740 |
| 2019 | $2,396 | $337,000 | $135,195 | $201,805 |
| 2018 | $2,247 | $311,000 | $132,691 | $178,309 |
| 2016 | $1,929 | $144,155 | $52,919 | $91,236 |
| 2015 | $1,494 | $103,675 | $52,919 | $50,756 |
| 2014 | $1,670 | $120,314 | $52,919 | $67,395 |
| 2013 | -- | $103,249 | $40,825 | $62,424 |
Source: Public Records
Map
Nearby Homes
- 2095 S Main St Unit 17
- 2095 S Main St Unit 23
- 1950 S 200 W Unit 32
- 2943 S 400 W
- 33 W Wicker Ln
- 1820 S 440 W
- 553 W 1880 S
- 117 W 3000 S
- 2008 S 700 W
- 1602 S 550 W
- 527 Applewood Dr
- 3183 S 500 W
- 269 E 2200 S
- 2281 S 250 E
- 770 W 1900 S
- 1314 S 200 W Unit 19
- 296 E 2050 S Unit 2
- 1350 S 200 W
- 320 E 2100 S
- 3238 S 675 W